Home Blog Page 7

LUNC Price Analysis: Bearish Structure Persists as Bitcoin Trends Toward 70K

LUNC Technical Analysis (1D – LUNC/USDT)

Market Context

Before analyzing LUNC itself, we must start with Bitcoin.

Bitcoin’s daily structure is currently in a downtrend with price moving toward the 70,000 USD region. Historically, when Bitcoin trends down or shows weakness:

  • Liquidity leaves altcoins first
  • Altcoins underperform Bitcoin
  • Relief rallies on altcoins tend to be short lived

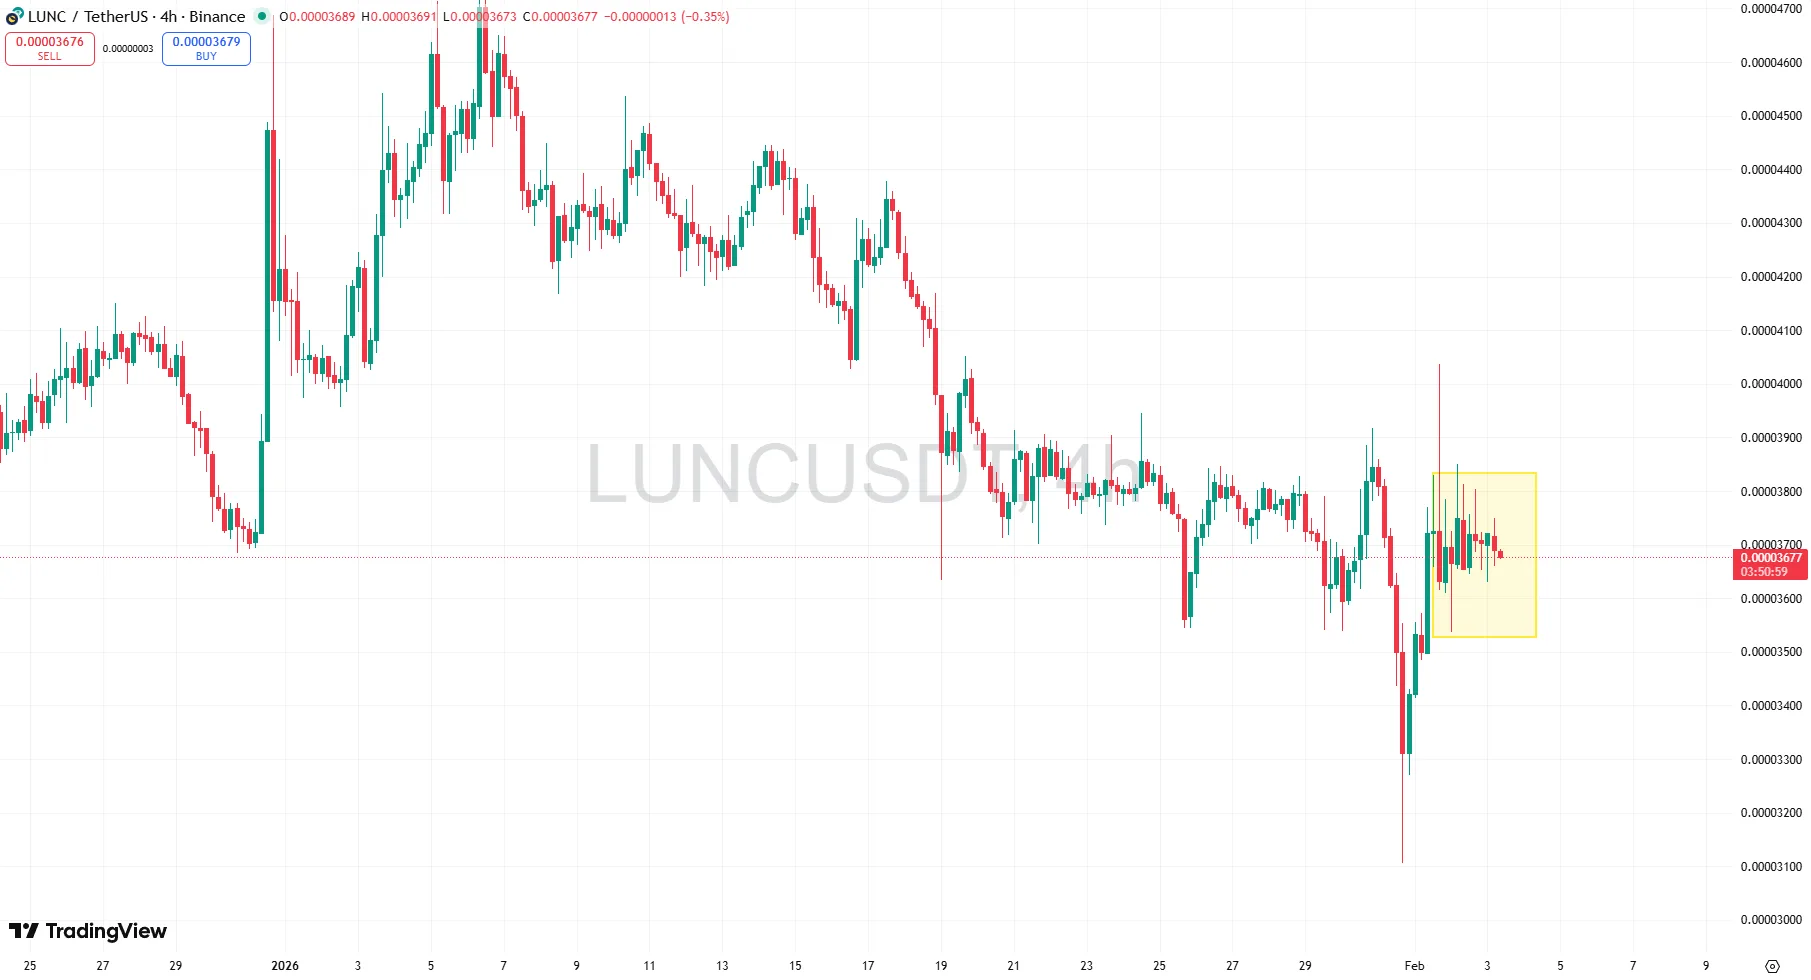
This macro pressure is clearly visible in the LUNC chart.

LUNC Market Structure

Primary Trend

LUNC remains in a clear long term downtrend.

  • Series of lower highs
  • Series of lower lows
  • Repeated rejection from resistance zones
  • No confirmed higher high on the daily timeframe

The large spike on the right side of the chart appears to be a news driven liquidity spike rather than a trend reversal. A single vertical pump does not change market structure.

Large Wick Event (Capitulation and Short Squeeze)

The chart shows two extreme candles:

  • A sharp liquidation wick downward
  • Immediately followed by a vertical pump

This typically signals massive liquidations and a short squeeze. After such events, markets usually enter consolidation or continue the main trend. Price quickly returned to sideways to downward movement, confirming this behavior.

Current Price Behavior

  • Price failed to hold the highs
  • Lower highs started forming again
  • The market moved into bearish consolidation

This shows buyers lack follow through. In simple terms, buyers reacted to news but are not strong enough to sustain a trend.

Key Levels

Major Resistance: 0.000045 – 0.000055

  • Previous support turned resistance
  • Post spike rejection zone
  • Sellers consistently appear here

LUNC must break and hold above this zone to start a bullish reversal discussion.

Mid Resistance: 0.000040

This is the current rejection area where price repeatedly fails, confirming weak momentum.

Major Support: 0.000030 – 0.000026

This is the most important level on the chart. If Bitcoin continues toward 70,000, this support becomes the primary downside target.

Capitulation Support: 0.000020 – 0.000017

This is the extreme liquidity zone from the long wick. If market risk increases, price often revisits these liquidity areas.

Momentum and Sentiment

  • Volatility spike already occurred
  • Momentum is fading
  • Volume declined after the pump
  • Market is returning to the main trend direction

This reflects classic bear market rally behavior.

Correlation with Bitcoin

Because Bitcoin is trending down toward 70,000, expected altcoin behavior includes:

  1. Lower liquidity
  2. Failed breakouts
  3. Range breakdown risk
  4. Gradual price decline

Upside moves may still occur short term, but they are likely temporary until Bitcoin stabilizes.

Probable Scenarios

Bearish Scenario (Higher Probability)

  • LUNC revisits 0.000030
  • Possible sweep of 0.000026 liquidity
  • Extended consolidation or gradual decline

Neutral Scenario

  • If Bitcoin stabilizes near 70,000
  • LUNC trades sideways between 0.000030 and 0.000045

Bullish Scenario (Low Probability)

  • Requires Bitcoin trend reversal
  • Break and hold above 0.000055
  • Formation of higher highs

Summary

  • Trend: Bearish
  • Structure: Lower highs and lower lows
  • Spike: Liquidity event, not reversal
  • Bitcoin trend adds pressure
  • Short term outlook: Sideways to down

Bitcoin Drops Toward 70K, Red Alert for LUNC

0

Bitcoin Market Analysis (BTCUSD 1D)

Market structure

Bitcoin has confirmed a major trend reversal on the daily timeframe.
After printing a cycle high near 124000 to 125000, price formed a lower high, a lower low, and then broke key support.
This confirms a daily downtrend structure.
The recent move is not a normal pullback. It is a capitulation leg.

What just happened on the chart

The most important event is the loss of the 90000 to 92000 support zone.
This level previously acted as range support in December and a bounce zone multiple times.
Once this level broke, sellers accelerated and we saw a vertical liquidation drop toward 70000.
This type of move usually indicates long liquidations, panic selling, and a shift from bullish to bearish momentum.

Current momentum

Recent candles show large bearish bodies and little bullish follow through.
Price is closing near daily lows, which means sellers still control the market.
There is no confirmed bottom yet.

Key support levels

  • 70000 zone. First reaction support and high volatility area.
  • 65000 to 66000. Previous consolidation zone and strong demand area.
  • 60000 to 62000. Major macro support and full correction territory.

Key resistance levels

  • 80000. First relief rally resistance.
  • 85000. Broken structure resistance.
  • 90000. Major trend flip level.

Only a reclaim above 90000 would weaken the bearish outlook.

Short term outlook

The most likely scenario is a temporary bounce near 70000 followed by continued volatility and retests.
The market is shifting from euphoria to fear.
This does not end the bull cycle, but it confirms a mid cycle correction.


LUNC Analysis

Current price: 0.000036 USD

Market context

When Bitcoin enters a strong correction, altcoins usually drop faster, recover slower, and lose liquidity.
LUNC historically has high correlation with Bitcoin, which means it moves more aggressively during market stress.

LUNC market structure

LUNC is currently in a macro downtrend continuation phase.
Bitcoin weakness removes retail momentum and speculative liquidity, which directly impacts LUNC.

Key support levels

  • 0.000034 to 0.000032. Immediate support zone and possible bounce area.
  • 0.000028. Strong historical support if Bitcoin drops toward 65000.
  • 0.000022 to 0.000025. Panic zone if Bitcoin approaches 60000.

Resistance levels

  • 0.000042. First trend resistance.
  • 0.000048. Structure reclaim level.
  • 0.000055. Momentum return zone.

Outlook

Short term, expect volatility and downside pressure with possible relief bounces.
Medium term recovery for LUNC will likely begin only after Bitcoin finds a stable bottom.


Summary

  • Bitcoin has entered a confirmed daily downtrend.
  • 70000 is the first major support but the bottom is not confirmed.
  • Altcoins including LUNC will likely remain under pressure.
  • LUNC may test lower supports if Bitcoin continues correcting.
  • This is a correction phase, not the end of the crypto cycle.

Over 1.5 Billion LUNC Burned in Just Four Days as February Opens Strong

Over 1.5 Billion LUNC Burned in Just Four Days as February Opens Strong

February has started with strong burn activity for Terra Classic. In just the first four days of the month, more than 1.5 billion LUNC has been permanently removed from circulation. This early momentum highlights the ongoing commitment to reducing supply and supporting the long term ecosystem recovery.

Binance Leads the Largest Burn of the Month

The largest burn occurred on February 1, driven primarily by Binance as part of its monthly LUNC burn program. On that day alone, Binance burned 1,082,000,899 LUNC, making it the most significant single contribution during this period.

This monthly burn initiative continues to play a major role in the Terra Classic burn strategy and remains one of the largest consistent sources of supply reduction.

Daily LUNC Burn Breakdown

Below is the daily burn activity recorded during the first four days of February.

Month Date LUNC Burn
February 1 1,147,191,675
February 2 168,648,532
February 3 55,419,874
February 4 138,464,391
Total 1,509,724,472

A Strong Start to February

With more than 1.5 billion LUNC burned in only four days, February has opened with strong momentum. The continued participation from major contributors and the broader community reflects ongoing support for supply reduction and long term ecosystem stabilization.

As the month continues, the community will be watching closely to see how burn activity develops and how it contributes to Terra Classic’s broader recovery efforts.

LUNC Staking Ratio Continues to Rise as Over 982 Billion Tokens Are Now Staked

0

LUNC Staking Ratio Continues to Rise

The Terra Classic ecosystem is showing renewed confidence as the LUNC staking ratio continues to move upward. Recent data confirms that the amount of staked LUNC has increased by approximately 3.5 billion tokens, pushing the total staked supply to more than 982 billion LUNC. This represents about 15.19 percent of the total circulating supply.

This steady increase highlights ongoing commitment from long term holders who are choosing to secure the network while earning staking rewards.

Early February Staking Trend

At the beginning of February, the staking ratio was already stable but experienced a small short term decline before reversing upward.

On February 1, the staking ratio stood at approximately 15.16 percent.

On February 2, the ratio dipped slightly to 15.13 percent.

Although the decrease was minor, it reflected normal short term movement often seen in staking activity.

Recovery and Continued Growth

Starting from February 3 until today, the trend shifted back to growth. The staking ratio resumed its upward movement and gained momentum, ultimately reaching 15.19 percent.

The addition of roughly 3.5 billion LUNC into staking in just a few days signals increasing confidence from the community. Higher staking levels typically reduce liquid supply available on the market, which can support long term ecosystem stability.

What Rising Staking Means for Terra Classic

An increasing staking ratio is often viewed as a positive signal for a blockchain network. When more tokens are staked, it indicates that holders are committed to supporting network security and participating in governance rather than selling their holdings.

For Terra Classic, continued staking growth suggests strengthening community engagement and ongoing belief in the project’s long term direction.

If this trend continues throughout February, the Terra Classic network could see further improvements in security, stability, and overall community participation.

Over 388,000 USTC Burned Today as Supply Reduction Accelerates

0

Over 388,000 USTC Burned Today as Supply Reduction Accelerates

The Terra Classic ecosystem continues to show strong supply reduction momentum. More than 388,000 USTC has already been burned today, and the day is not over yet. This ongoing activity highlights the community’s continued commitment to reducing the circulating supply of USTC.

Strong Burn Activity Continues

USTC burn activity has remained active throughout the day, pushing the total burned amount 388,335 tokens so far. With several hours still remaining, the final total is expected to grow further as additional burn transactions are completed.

Supply reduction remains one of the most closely watched metrics in the Terra Classic ecosystem. Every burn permanently removes tokens from circulation, helping strengthen long term confidence and support the broader recovery strategy.

Why the USTC Burn Matters

Token burns play a key role in the long term sustainability of the ecosystem. By gradually reducing the circulating supply, the community aims to create healthier tokenomics and support future growth.

Consistent burn activity also signals continued engagement from the community and ecosystem participants who are actively contributing to the supply reduction initiative.

Looking Ahead

With the daily burn total already exceeding 388,000 USTC and more time remaining in the day, the final figure may rise even higher. The continued pace of burn activity reflects steady progress in the Terra Classic recovery journey.

Further updates are expected as the day concludes and final burn data becomes available.

Nearly Half a Million USTC Burned in Just 4 Days as February Starts Strong

0

Nearly Half a Million USTC Burned in Just Four Days as February Starts Strong

February 2026 has opened with steady USTC burn activity across the Terra Classic ecosystem. In the first four days of the month, a total of 469,119 USTC has already been removed from circulation.

This early momentum highlights continued community and ecosystem participation in the long term effort to reduce supply.

It is important to note that the burn data for February 4 is still ongoing, meaning the total is expected to increase further.

Daily USTC Burn Breakdown

The following table shows the recorded daily burns so far.

Month Date USTC Burned
February 1 32,646
February 2 25,778
February 3 22,360
February 4 388,335
Total 469,119

February 4 Drives the Majority of Burns

The most significant burn so far occurred on February 4, which accounts for the majority of the current total. With the day still in progress, this number may continue to grow as additional burn transactions are recorded.

Large single day burn spikes like this often play an important role in accelerating supply reduction milestones.

What This Means for the Terra Classic Ecosystem

USTC burns remain a key component of the broader Terra Classic recovery strategy. Every burn permanently removes tokens from circulation, contributing to long term supply reduction goals.

While the burn amount is modest compared to total supply, consistent daily activity continues to demonstrate ongoing ecosystem engagement and commitment.

With February just beginning, the community will be watching closely to see how burn activity develops in the coming weeks.

LUNC Price Analysis: Sideways Stability After Market Liquidation Shock

1. Market Context: What Just Happened

On January 31, 2026, the crypto market experienced a major shock.

  • Over $2.56 billion in leveraged positions were liquidated across the market
  • Bitcoin dropped sharply to the $74,000 level
  • Panic selling and forced liquidations spread across altcoins

Because LUNC is highly influenced by overall market sentiment, price dropped aggressively to around $0.000031 during this event.

This move was driven by macro market stress, not by changes in LUNC fundamentals.


2. The Drop: Why LUNC Fell So Fast

On the four hour chart, several clear technical signals appeared.

  • A strong bearish impulse candle formed
  • Volatility spiked with long wicks, indicating forced selling
  • The breakdown was driven mainly by liquidations, not organic selling

This type of move usually occurs when:

  • Traders are over leveraged
  • Stop losses and margin calls trigger simultaneously

For beginners:
This was a liquidation driven crash, not a project failure.


3. The Recovery: Why This Is Important

After the drop to $0.000031, LUNC began to recover.

  • Price bounced quickly from the panic low
  • Selling pressure weakened significantly
  • Buyers stepped in consistently

At the same time:

  • Bitcoin recovered only to around the $77,000 level
  • LUNC did not continue falling

This confirms one important signal.

Selling exhaustion has occurred.


4. Sideways Structure: What the Yellow Box Means

The yellow box on the chart represents consolidation.

Key characteristics:

  • Price moving sideways
  • Lower volatility compared to the sell off phase
  • Buyers and sellers reaching temporary balance

This structure is a classic accumulation range after a strong drop.

For beginners:

  • Sideways movement after a crash often means the market is deciding the next direction
  • Strong assets usually consolidate instead of continuing to dump

5. Strength Signal: Why LUNC Is Holding Well

Despite Bitcoin still being below recent highs:

  • LUNC is not making new lows
  • Price is holding above the panic low
  • Buyers are actively defending the current range

This behavior suggests:

  • Stronger hands are accumulating
  • Weak hands already exited during the liquidation event
  • Market confidence is slowly rebuilding

In simple terms:
LUNC is showing relative strength compared to the broader market.


6. Key Levels to Watch (Beginner-Friendly)

Based on the current chart structure:

  • Support zone: $0.000031 to $0.000034
  • Current consolidation range: $0.000035 to $0.000038
  • Next resistance level: Near $0.000040

As long as price remains inside this range and does not break down, the overall structure remains healthy.


7. Professional Conclusion

From a professional technical perspective:

  • The decline was caused by an external market shock
  • LUNC successfully absorbed heavy selling pressure
  • Price is now stabilizing and trading sideways

For beginners:
This does not mean an immediate price surge, but it does suggest that the worst panic phase is likely over, with LUNC showing more stability than many market participants expected.

Over 50,000 USTC Burned in the First 2 Days of February

Over 50,000 USTC Burned in the First Two Days of February

The Terra Classic ecosystem has recorded a strong start to February, with a significant amount of USTC removed from circulation within just two days. According to the latest burn data, more than 58,000 USTC tokens have already been permanently burned.

Token burning plays an important role in reducing circulating supply over time, supporting long term ecosystem stability and value alignment.

Daily USTC Burn Breakdown

Below is the detailed daily burn recap for the first two days of February.

Date Month USTC Burned
February 1 February 32,646
February 2 February 25,778
Total 58,424

What This Means for the Terra Classic Ecosystem

Consistent USTC burns demonstrate ongoing community and ecosystem efforts to gradually reduce supply. While daily burn figures may vary, maintaining steady progress remains a key objective for long term sustainability.

Final Thoughts

Burning over 50,000 USTC in just two days reflects continued commitment to supply reduction within the Terra Classic ecosystem. If this pace continues, February could contribute meaningfully to broader long term burn goals.

Over 1.3 Billion LUNC Burned in Just Two Days at the Start of February 2026

Over 1.3 Billion LUNC Burned in Just Two Days at the Start of February 2026

February 2026 has started on a strong note for the Luna Classic ecosystem, with a significant amount of LUNC already removed from circulation. In just the first two days of the month, a total of 1,315,840,207 LUNC has been burned, reinforcing ongoing efforts to reduce supply and support long term network sustainability.

The largest contribution came on February 1, driven mainly by Binance monthly LUNC burn activity. Binance accounted for 1,082,000,899 LUNC burned, making it the single biggest contributor during this period. This continued commitment from Binance remains a key factor in the overall LUNC burn progress.

Additional burns on February 2 further increased the total, showing that burn activity remains consistent beyond scheduled exchange burns and includes broader ecosystem participation.

Daily LUNC Burn Summary

Month Date LUNC Burned
February 1 1,147,191,675
February 2 168,648,532
Total 1,315,840,207

The early momentum seen in February highlights the continued focus on supply reduction within the Luna Classic community. With major contributors like Binance maintaining their burn programs and additional burns occurring daily, the network continues to move toward its long term goals.

As February progresses, the community will be watching closely to see whether this strong burn pace can be maintained throughout the month.

iDev.Games Brings 9 Years of Gaming to Terra Classic with IDEV Token Launch

A proven gaming platform with 2.8 million plays integrates blockchain rewards—no wallet required to start earning

The Terra Classic ecosystem just gained access to something rare in crypto gaming: a platform that existed long before its token did. iDev.Games, operational since 2016 with 1,420 games and over 2.8 million lifetime plays, has launched IDEV—a gaming rewards token with an innovative redemption system designed to create sustainable buy pressure.

Platform First, Token Second

Unlike the wave of “web3 gaming” projects that launched tokens and hoped games would follow, iDev.Games took the opposite approach. The platform has been running for nine years, accumulating 6,000 registered users and 700,000 annual visitors before blockchain entered the picture.

“We had an internal economy called Dev Coins running for years,” explains the platform’s founder. “Over 5 million Dev Coins are in circulation. We just connected it to Terra Classic.”

Recent activity metrics show the platform’s health: 14,537 game plays in the last week alone, with users spending nearly 7 days of cumulative playtime. The games aren’t just uploaded and forgotten—they’re actively played.

How the Two-Tier Economy Works

The IDEV system operates on two levels:

Dev Coins (Off-Chain): Players and developers earn these through platform activity—playing games, uploading content, and engaging with the community. This system has been running for years with a remarkably controlled 0.36% weekly inflation rate.

IDEV Tokens (On-Chain): Users can now redeem Dev Coins for IDEV tokens at ratios based on their IDEV holdings:

  • Hold 0-9,999 IDEV: Redeem at 10:1 ratio
  • Hold 10,000+ IDEV: Redeem at 8:1 ratio (25% better)
  • Hold 50,000+ IDEV: Redeem at 5:1 ratio (100% better)
  • Hold 100,000+ IDEV: Redeem at 3:1 ratio (233% better)
  • Hold 500,000+ IDEV: Redeem at 1:1 ratio (maximum tier)

Daily redemption limits (10,000 Dev Coins) prevent dumping while the tier system creates organic demand—users want to hold IDEV to improve their earning efficiency.

Liquidity Structure Drives Activity

IDEV launched with a focused liquidity strategy across multiple Garuda DeFi V2 pairs:

  • ELPACO/IDEV: $2,069 liquidity (primary pair)
  • IDEV/LTK: $948 liquidity
  • DO/IDEV: $408 liquidity
  • IDEV/GRDX: $400 liquidity

Within hours of launching the IDEV-focused pool structure, arbitrage bot activity increased dramatically—a signal that the pool configuration is generating real trading opportunities rather than sitting idle.

No Wallet Required to Start

Terra Classic users can play games on iDev.Games immediately without connecting wallets. Dev Coins accumulate in the background based on playtime and engagement. Only when ready to claim IDEV tokens do users need a Terra Classic wallet address.

This removes the web3 friction that causes low adoption most blockchain gaming projects face.

What This Means for Terra Classic

IDEV represents a different approach to ecosystem growth—connecting an established user base to blockchain rather than hoping blockchain users will adopt a new platform.

With 6,000 developers potentially discovering they can convert years of accumulated Dev Coins into tradable tokens, and Terra Classic users finding an actual gaming platform worth engaging with, IDEV could demonstrate what sustainable blockchain gaming looks like.

The platform also operates Lunc Tools World and holds the ELPACO utility token, creating multiple connection points between traditional indie game development and the Terra Classic ecosystem.

Key Details:

  • Platform: iDev.Games (https://idev.games)
  • Whitepaper: https://idev.games/iDev_Token_Whitepaper.pdf
  • Token: IDEV on Terra Classic
  • Redemption: Available through user dashboard (Input your Terra Classic wallet)
  • Trading: Live on Garuda DeFi V2
  • Games: 1,420+ playable HTML5 titles
  • History: 9 years operational, 2.8M+ lifetime plays

For Terra Classic users tired of speculation-only tokens, iDev.Games offers something different: a reason to hold based on utility, not hopium.