

February 19 Records Lowest Daily LUNC Burn in February as On Chain Volume Declines
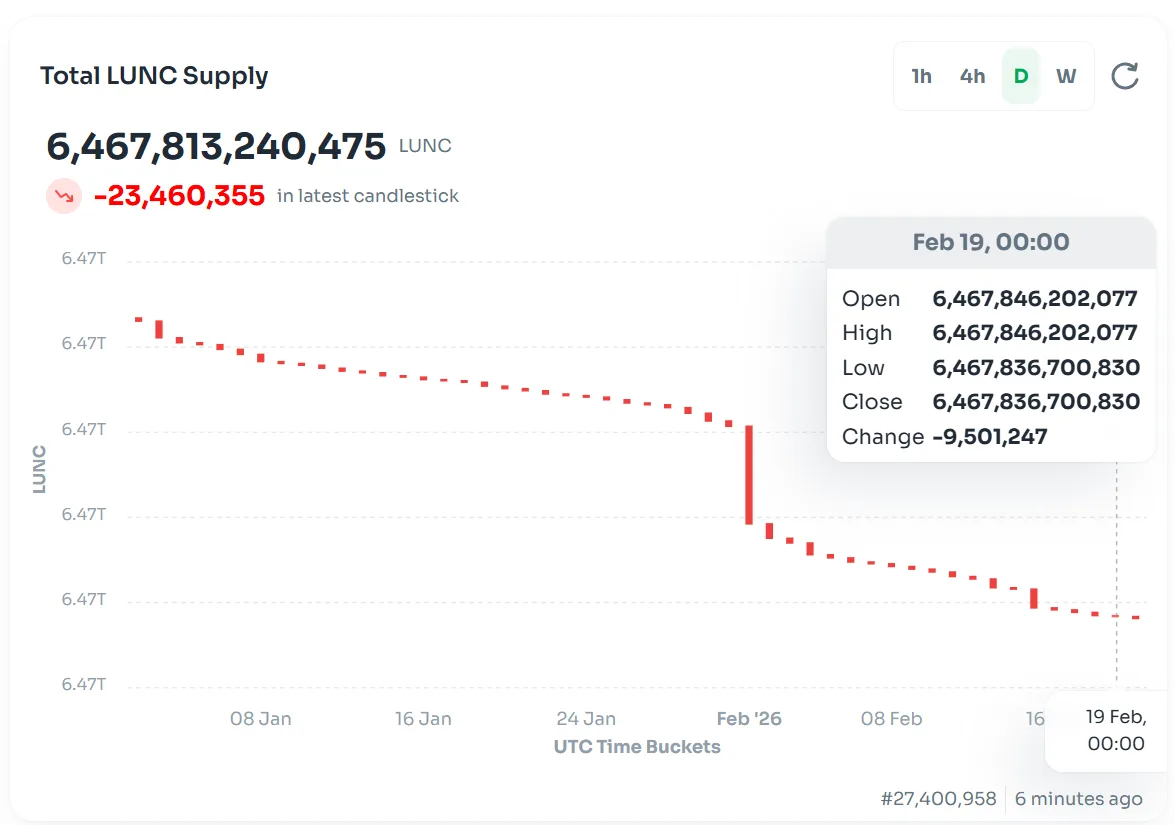
February 19 marked the lowest daily LUNC burn in February, with only 9,401,247 LUNC removed from circulation on that day.
This was the weakest daily burn performance recorded during the month. The main reason behind the sharp decline was lower on chain transaction volume, which directly affects the amount of LUNC sent to the burn mechanism.
The Terra Classic burn model is closely tied to network activity. When transaction volume increases, more LUNC is burned. When activity slows down, the daily burn amount also decreases. February 19 clearly reflected a period of reduced blockchain usage compared to earlier days in the month.
In contrast, February 1 recorded the highest daily burn of the month, exceeding 1.14 billion LUNC. The majority of this burn came from Binance as part of its monthly LUNC burn program, where the exchange periodically burns trading fee revenue collected from LUNC spot and margin trading pairs. This contribution created a significant gap compared to the 9.4 million LUNC burned on February 19, which was driven primarily by regular on chain activity rather than a large exchange burn event.
Despite the slowdown on that specific day, total LUNC burned between February 1 and February 19 reached 2,234,563,413 tokens. This shows that overall monthly burn activity remains substantial even with daily fluctuations.
Daily LUNC Burn Breakdown for February
| Month | Date | LUNC Burn |
|---|---|---|
| February | 1 | 1,147,191,675.00 |
| February | 2 | 168,648,532.00 |
| February | 3 | 55,419,874.00 |
| February | 4 | 138,464,391.00 |
| February | 5 | 36,216,303.00 |
| February | 6 | 48,908,522.00 |
| February | 7 | 20,794,946.00 |
| February | 8 | 32,404,845.00 |
| February | 9 | 30,669,205.00 |
| February | 10 | 33,716,529.00 |
| February | 11 | 52,436,522.00 |
| February | 12 | 30,121,985.00 |
| February | 13 | 101,813,794.00 |
| February | 14 | 17,099,526.00 |
| February | 15 | 220,095,107.00 |
| February | 16 | 23,780,105.00 |
| February | 17 | 28,166,825.00 |
| February | 18 | 39,213,480.00 |
| February | 19 | 9,401,247.00 |
| Total | 2,234,563,413.00 |
The February 19 data highlights how sensitive the LUNC burn rate is to network participation. Sustained on chain activity remains the key factor in maintaining consistent supply reduction over time, especially when large exchange driven burns are not present.