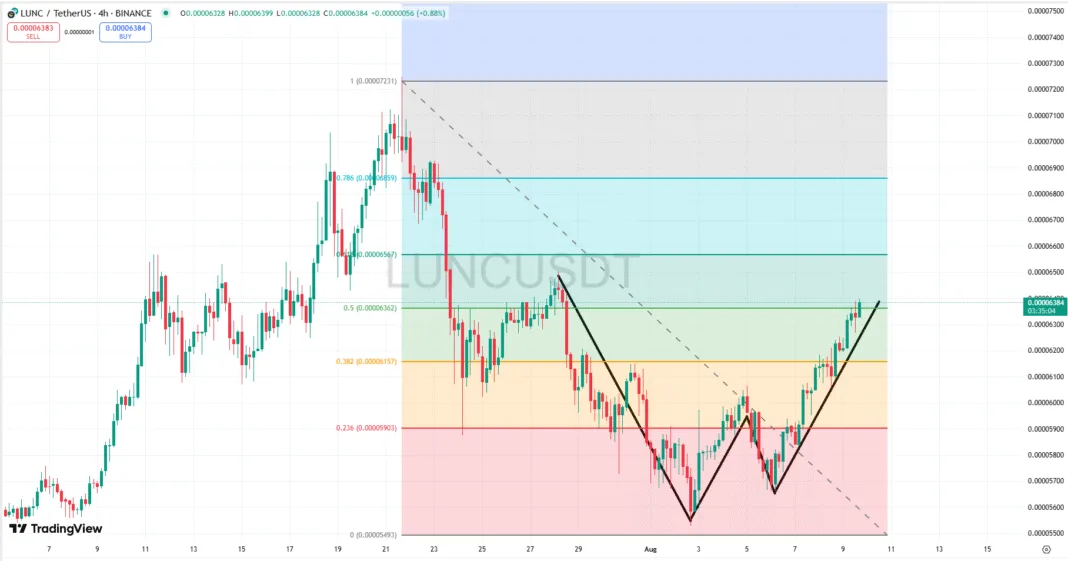
LUNC has demonstrated notable bullish momentum in recent sessions, breaking above the 0.5 Fibonacci retracement level. This move signals increasing buyer confidence and opens the path toward higher resistance levels.
The immediate resistance is positioned near 0.00006567, corresponding to the 0.618 Fibonacci level, followed by 0.00006859 at the 0.786 level. A sustained breakout above these points could propel the price toward the recent peak of 0.00007231.
Chart patterns suggest a clear “W” recovery formation, often regarded as a bullish reversal indicator. This structure reflects a strong shift from a bearish phase toward potential upward continuation.
Momentum indicators remain positive, with higher lows and consistent upward candle formations reinforcing the current trend. As long as the price maintains levels above 0.00006362, the bullish outlook remains intact.
If buying pressure persists, LUNC could challenge higher Fibonacci levels in the coming days, with the potential to revisit recent highs and extend the rally further.

