

LUNC USDT 4H Technical Analysis
Market context
After a prolonged downtrend and a long period of sideways movement, the chart is now showing a clear shift in short term direction. The most recent candles show buyers stepping in and pushing price upward.
Today’s price action
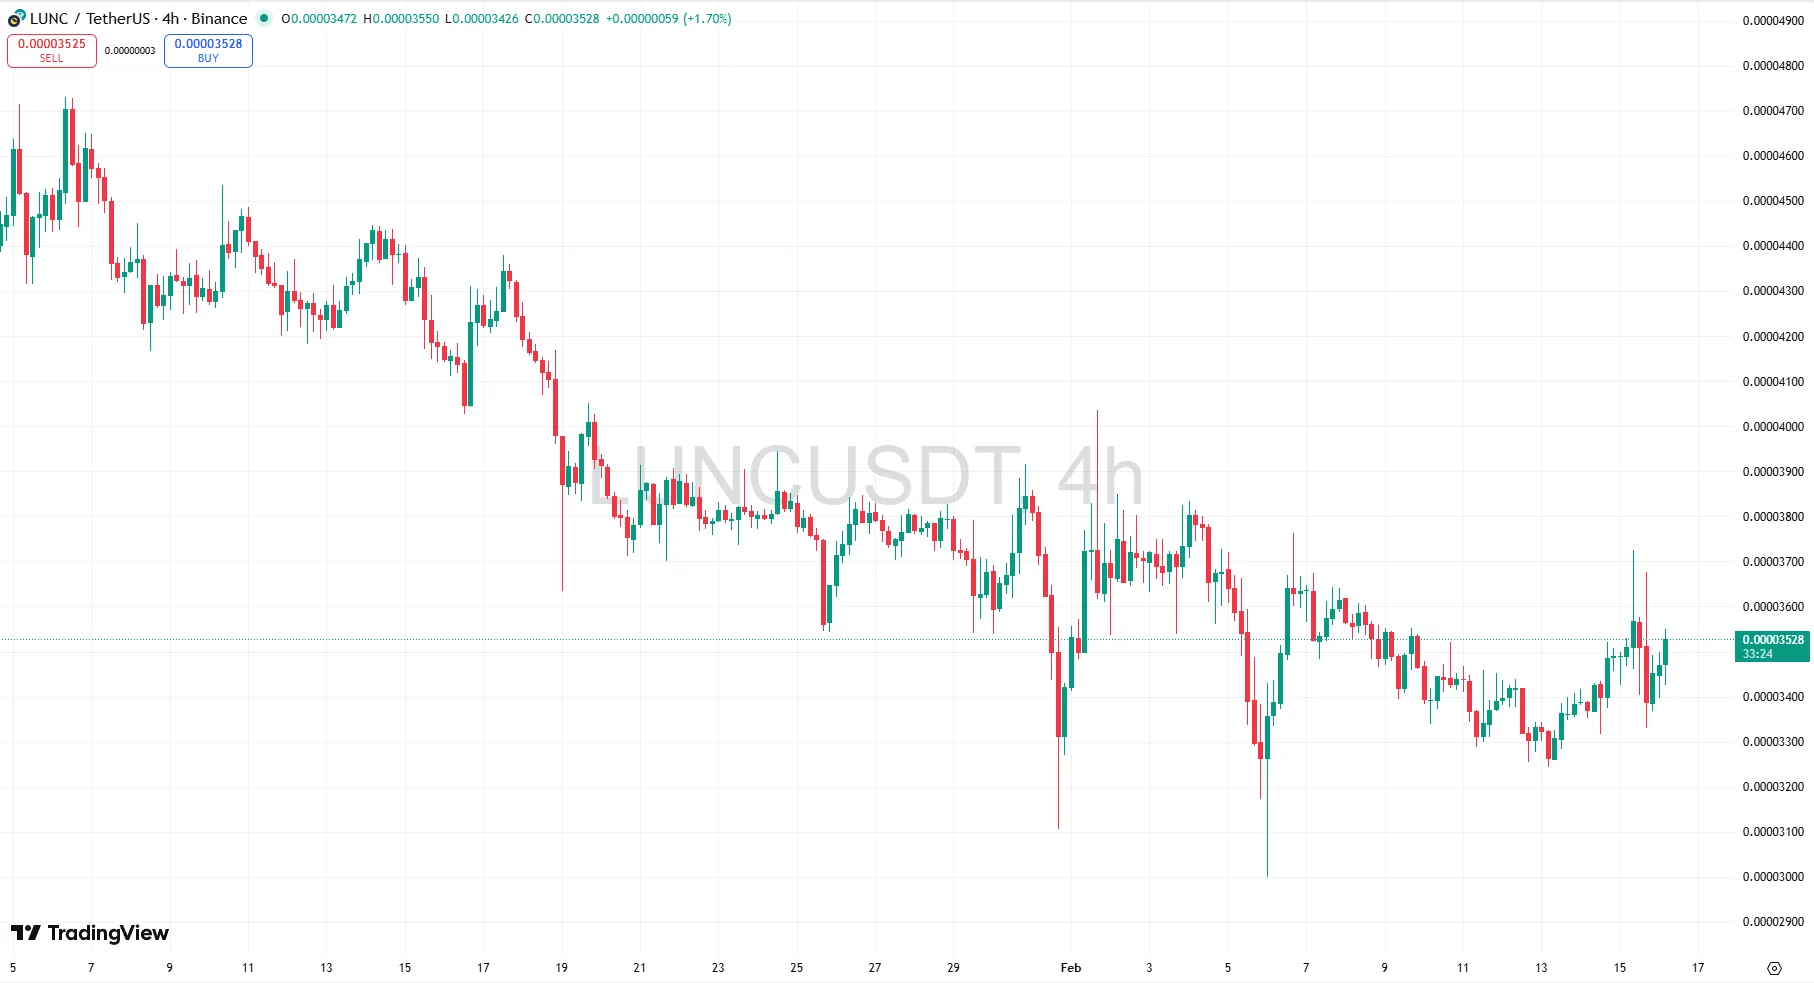
On the right side of the chart, price has started moving up from the recent local bottom near the 0.000033 area.
- A higher low
- A breakout above short term resistance near 0.000035
- Continuation candles holding above that level
This confirms the start of a short term uptrend on the 4H timeframe.
Momentum shift
Before today, price was drifting sideways with weak movement and no direction. Today, the behavior changed.
- Buyers are stepping in quickly on dips
- Pullbacks are shallow
- Price is moving upward in waves
This is the first sign of real bullish momentum returning.
Resistance turning into support
The zone around 0.000035 acted as resistance multiple times earlier on the chart. Today price broke above it and is now holding above it.
When resistance becomes support, it usually signals continuation to the upside. This is one of the strongest early bullish signals on the chart.
Higher lows structure
The most important change is the formation of higher lows. Price is no longer making new lows. Instead, each pullback is stopping higher than the previous one.
Higher lows are the foundation of every uptrend.
Key resistance ahead
The next major resistance zone sits around 0.0000365 to 0.000038. This area previously rejected price multiple times.
Price is now approaching this level with rising momentum. If this zone breaks, the market exits the short term range and confirms a stronger bullish continuation.
Bullish scenario
If buyers continue defending dips and price breaks above 0.000038, the move can accelerate quickly due to breakout momentum and trapped sellers re entering the market.
Final conclusion
LUNC has started moving up on the 4H timeframe. Today’s price action confirms the beginning of a short term bullish trend. Momentum is shifting to buyers, resistance has turned into support, and the market is pushing toward the next breakout level.
The chart now shows early signs of a new upward move beginning.