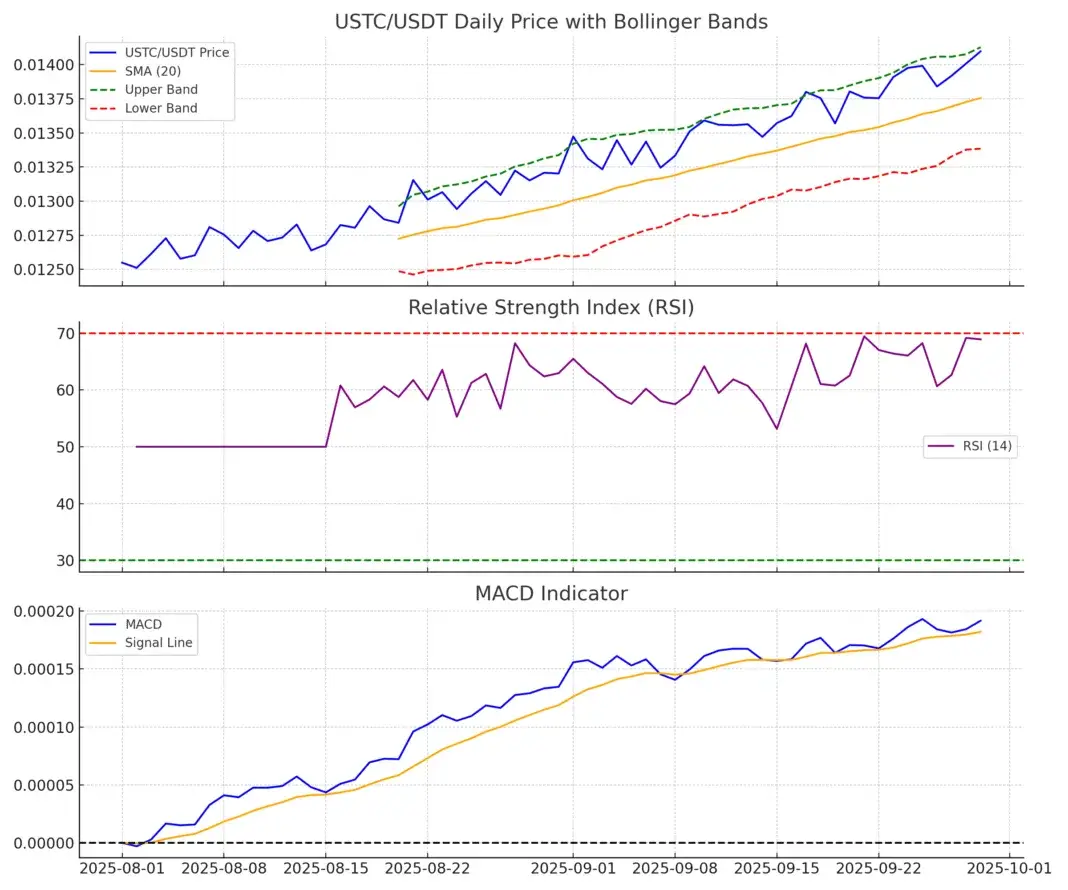
Current Price: ~$0.01358
Daily Range: $0.01336 – $0.01381
Change: +0.016%
Technical Overview
● Momentum Indicators: RSI and Stochastics show steady buying pressure.
● Moving Averages: All major MAs (5–200) are aligned bullish, signaling a strong short-term trend.
● Chart Pattern: USTC has formed a higher-low structure, which often signals continuation to the upside.
● Pivot Zone: $0.01353–$0.01357 is the critical level to watch.
Short-Term Forecast
● A decisive break above $0.01360 could lead to a test of $0.0138 or higher.
● Failure to hold support may trigger a pullback toward $0.0134–$0.0135.
Long-Term Perspective
While daily signals are bullish, monthly outlooks remain mixed, with some sell indicators suggesting this move may be temporary unless confirmed by stronger volume and momentum.
Conclusion
USTC/USDT is showing bullish momentum in the short term, supported by technical indicators and moving averages. Traders should monitor the $0.01353–$0.01357 pivot zone closely, as it will likely determine whether USTC continues higher or faces another pullback.

