



LUNC Price Tests Key Support on the 4 Hour Chart as Market Awaits Direction
Luna Classic is currently trading at an important technical level on the 4 hour timeframe. Price action shows that LUNC has entered a consolidation phase after failing to continue its previous bullish momentum. At this stage, the market is not in a strong trend and is instead moving within a defined range.
Market Structure Overview
On the 4-hour timeframe, LUNC is currently moving in a range-bound market.
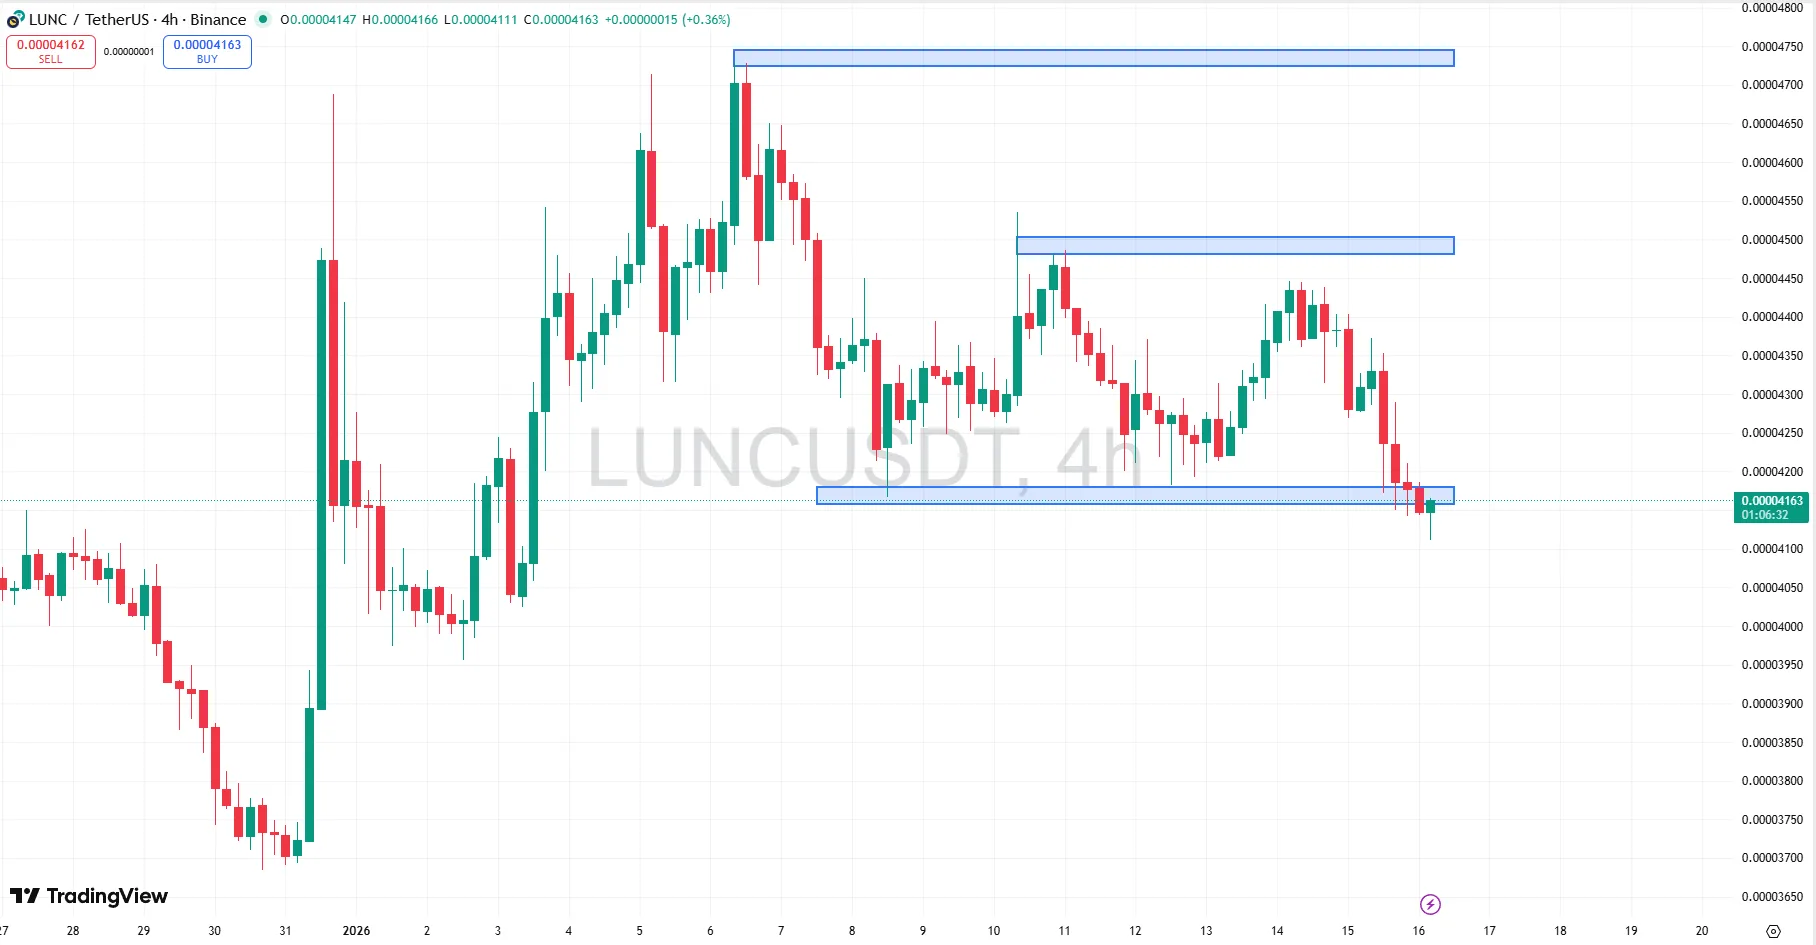
This means price is not trending strongly upward or downward but is instead moving between clearly defined support and resistance zones. For beginners, this type of market indicates that buyers and sellers are in balance, and price is waiting for confirmation before choosing a direction.
After reaching a recent local high, selling pressure increased and pushed price lower. However, the decline has been controlled rather than aggressive, suggesting the absence of panic selling. This behavior often appears when the market is waiting for a new catalyst.
Key Support Zone
The most important level to watch is the support area between 0.0000410 and 0.0000420. This zone has acted as a strong technical floor, with price reacting to it multiple times in the past.
Recent candles near this area show smaller bodies, which typically signals that selling pressure is weakening. If buyers continue to defend this zone, a short term bounce becomes possible.
Key Resistance Zones
Above the current price, two resistance areas stand out clearly.
The first resistance zone is located around 0.0000445 to 0.0000450. This level has previously limited upward movement.
The major resistance zone sits between 0.0000470 and 0.0000480. This area represents strong historical selling pressure and would require strong momentum and volume to break.
Possible Price Scenarios
If the support zone holds, LUNC may attempt a recovery move toward the first resistance level. Confirmation would come from strong bullish candles closing above support.
If the support fails and price closes decisively below the support zone, further downside becomes more likely. In this scenario, patience is required while the market forms a new base.
Trading Perspective
From a professional trading perspective, this is not a market for chasing price. Range-bound conditions favor traders who wait for clear reactions at support or resistance.
Risk management remains critical, as false breakouts are common in sideways markets.
Conclusion
LUNC is currently at a decision point on the 4 hour chart. The next major move will depend on whether buyers can successfully defend the current support zone or if sellers regain control.
Staying disciplined and waiting for confirmation remains the most effective approach in the current market structure.