
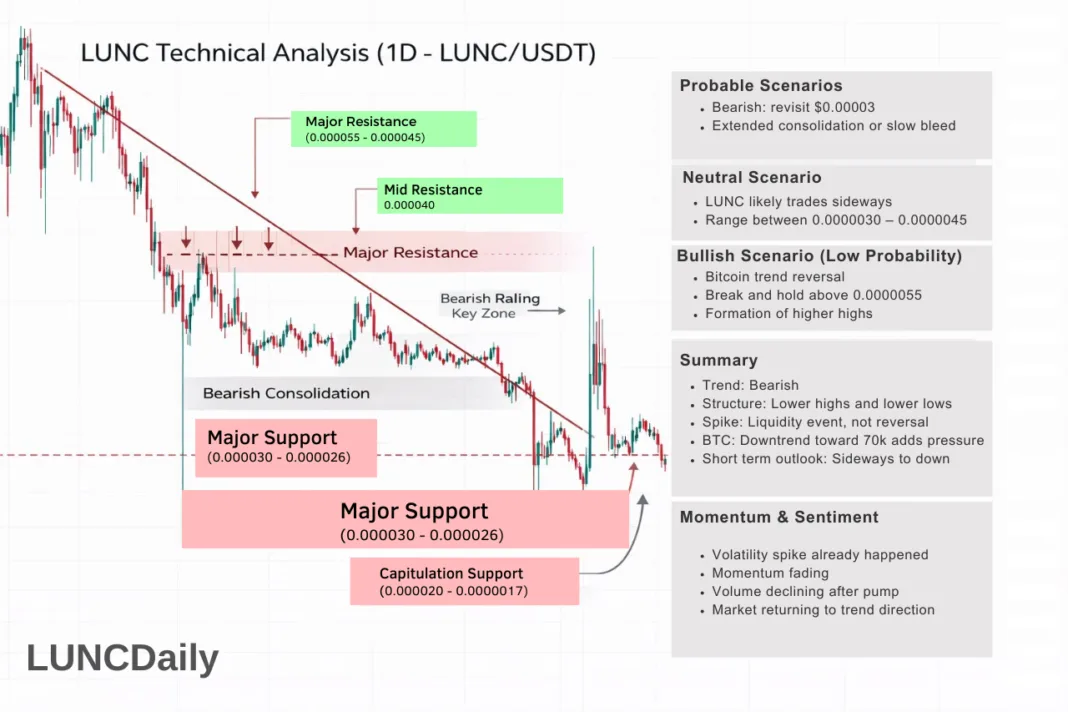


LUNC Technical Analysis (1D – LUNC/USDT)
Market Context
Before analyzing LUNC itself, we must start with Bitcoin.
Bitcoin’s daily structure is currently in a downtrend with price moving toward the 70,000 USD region. Historically, when Bitcoin trends down or shows weakness:
- Liquidity leaves altcoins first
- Altcoins underperform Bitcoin
- Relief rallies on altcoins tend to be short lived
This macro pressure is clearly visible in the LUNC chart.
LUNC Market Structure
Primary Trend
LUNC remains in a clear long term downtrend.
- Series of lower highs
- Series of lower lows
- Repeated rejection from resistance zones
- No confirmed higher high on the daily timeframe
The large spike on the right side of the chart appears to be a news driven liquidity spike rather than a trend reversal. A single vertical pump does not change market structure.
Large Wick Event (Capitulation and Short Squeeze)
The chart shows two extreme candles:
- A sharp liquidation wick downward
- Immediately followed by a vertical pump
This typically signals massive liquidations and a short squeeze. After such events, markets usually enter consolidation or continue the main trend. Price quickly returned to sideways to downward movement, confirming this behavior.
Current Price Behavior
- Price failed to hold the highs
- Lower highs started forming again
- The market moved into bearish consolidation
This shows buyers lack follow through. In simple terms, buyers reacted to news but are not strong enough to sustain a trend.
Key Levels
Major Resistance: 0.000045 – 0.000055
- Previous support turned resistance
- Post spike rejection zone
- Sellers consistently appear here
LUNC must break and hold above this zone to start a bullish reversal discussion.
Mid Resistance: 0.000040
This is the current rejection area where price repeatedly fails, confirming weak momentum.
Major Support: 0.000030 – 0.000026
This is the most important level on the chart. If Bitcoin continues toward 70,000, this support becomes the primary downside target.
Capitulation Support: 0.000020 – 0.000017
This is the extreme liquidity zone from the long wick. If market risk increases, price often revisits these liquidity areas.
Momentum and Sentiment
- Volatility spike already occurred
- Momentum is fading
- Volume declined after the pump
- Market is returning to the main trend direction
This reflects classic bear market rally behavior.
Correlation with Bitcoin
Because Bitcoin is trending down toward 70,000, expected altcoin behavior includes:
- Lower liquidity
- Failed breakouts
- Range breakdown risk
- Gradual price decline
Upside moves may still occur short term, but they are likely temporary until Bitcoin stabilizes.
Probable Scenarios
Bearish Scenario (Higher Probability)
- LUNC revisits 0.000030
- Possible sweep of 0.000026 liquidity
- Extended consolidation or gradual decline
Neutral Scenario
- If Bitcoin stabilizes near 70,000
- LUNC trades sideways between 0.000030 and 0.000045
Bullish Scenario (Low Probability)
- Requires Bitcoin trend reversal
- Break and hold above 0.000055
- Formation of higher highs
Summary
- Trend: Bearish
- Structure: Lower highs and lower lows
- Spike: Liquidity event, not reversal
- Bitcoin trend adds pressure
- Short term outlook: Sideways to down