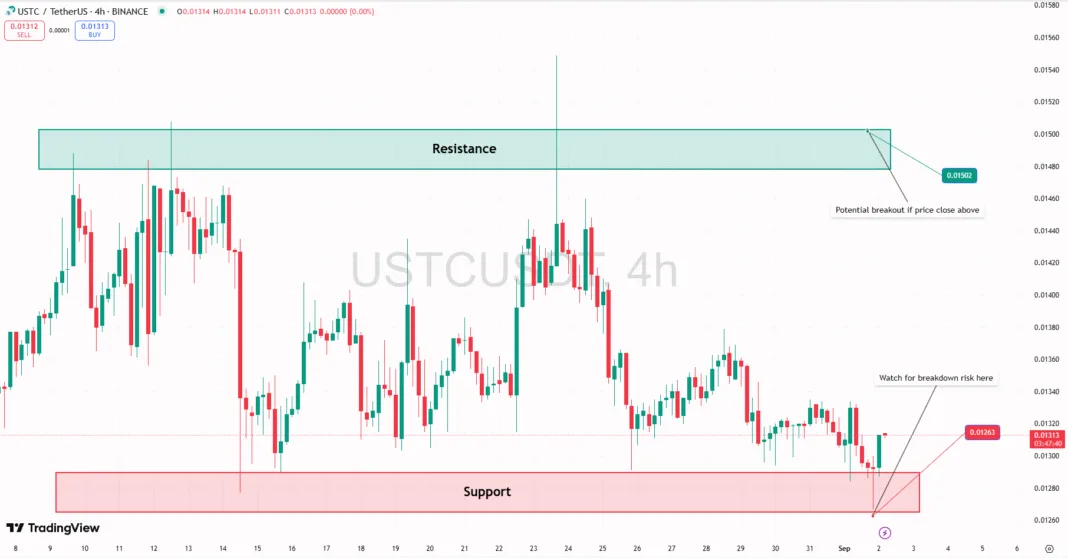
USTC is showing signs of consolidation as price trades within a defined range, creating a neutral market bias. On the 4-hour chart, USTC is moving between a resistance zone of $0.0150 – $0.0155 and a support zone of $0.0127 – $0.0130.
This price action suggests that both buyers and sellers are waiting for confirmation before making large moves. Volatility is shrinking, which often signals that a significant breakout may be approaching.
Key points from the chart:
● Resistance zone: $0.0150 – $0.0155. A close above this level may trigger momentum buying toward $0.0170.
● Support zone: $0.0127 – $0.0130. A breakdown here could lead to a move toward $0.0120 or lower.
● Volume is critical: Any breakout must be supported by strong trading volume to be reliable.
What this means for traders and investors:
● Traders may look for entries after a confirmed breakout above resistance or breakdown below support.
● Long-term investors may view this as an accumulation phase, taking entries near support with strict risk management.
This analysis reflects market structure, not speculation, and aims to provide a clear picture of current price behavior. As always, conduct your own research before making any investment decisions.

