

The LUNC USDT chart on the 4 hour timeframe is currently showing a clear short term bullish structure. Price action is moving within a well defined ascending channel, which is a classic technical pattern that reflects controlled and healthy upward momentum.
After a strong impulsive move to the upside, LUNC entered a phase of consolidation while continuing to print higher lows. This behavior indicates that buyers remain active and are stepping in earlier during pullbacks. Rather than signaling weakness, the recent red candles represent a normal correction within an ongoing uptrend.
The ascending channel visible on the chart highlights two important technical zones. The lower boundary of the channel is acting as dynamic support, where buying interest consistently appears. The upper boundary serves as resistance, where price temporarily slows or pulls back before attempting another push higher.
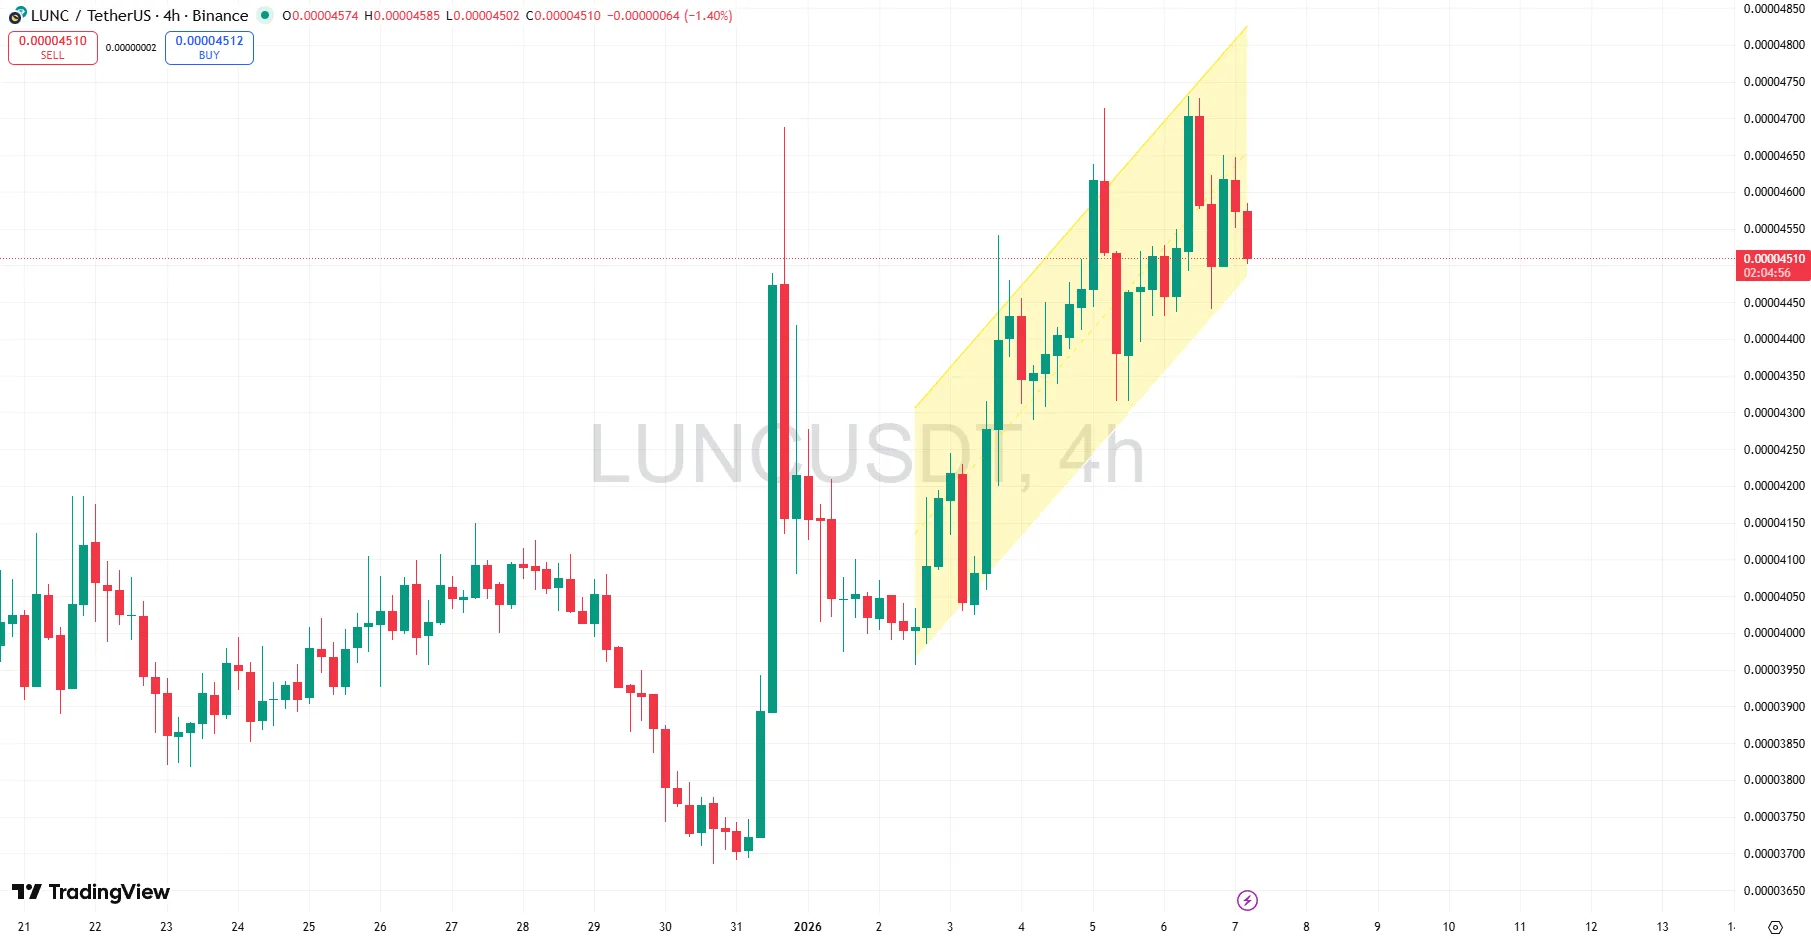
As long as LUNC price remains above the lower channel support, the bullish structure remains intact. A sustained breakout above the upper channel resistance could open the door for trend acceleration and stronger upside momentum. On the other hand, a confirmed breakdown below the channel would suggest weakening momentum and the potential for a deeper consolidation phase.
Overall, the current market structure favors the bulls. Momentum is constructive, pullbacks are controlled, and the trend remains positive unless key support levels are lost. Traders and investors should continue to monitor channel support and resistance for confirmation of the next major move.