Over 800,000 USTC Already Burned in January So Far
The Terra Classic ecosystem has continued to reduce the supply of USTC, with burn activity showing steady progress throughout January. As of January 29, a total of 802,228 USTC has already been removed from circulation.
While daily burn amounts vary, the overall trend reflects consistent participation from the community and ongoing efforts to support long term supply reduction.
It is important to note that data for January 29 is not yet final, meaning the total burn figure is expected to increase further before the month concludes.
Daily USTC Burn Breakdown for January
Month
Date
USTC Burn
January
1
33,407
January
2
93,158
January
3
15,065
January
4
7,253
January
5
15,637
January
6
7,618
January
7
9,758
January
8
33,196
January
9
58,758
January
10
115,023
January
11
8,474
January
12
7,387
January
13
18,707
January
14
6,542
January
15
9,397
January
16
9,043
January
17
8,298
January
18
5,860
January
19
131,816
January
20
17,210
January
21
44,796
January
22
77,570
January
23
10,421
January
24
14,897
January
25
13,725
January
26
13,261
January
27
7,534
January
28
5,749
January
29
2,668
Total USTC Burned So Far
Total USTC burned in January: 802,228
January 29 burn data is still in progress and the final monthly total is expected to be higher.
What This Means for USTC
Although individual daily burn numbers may appear modest, the cumulative effect highlights steady progress. Continued consistency remains key for long term impact on USTC supply dynamics.
As Terra Classic development and community initiatives evolve, burn activity remains an important metric to monitor in the broader recovery strategy.
Over 6.4 Billion LUNC Burned in January 2026 So Far
The Terra Classic network has recorded strong burn activity in January 2026, with a total of 6,422,393,887 LUNC burned within the first 28 days of the month. This continued reduction in circulating supply highlights ongoing efforts by exchanges, validators, and the wider community to support the long term recovery of the LUNC ecosystem.
The most significant contribution occurred on January 1, when Binance executed its scheduled monthly LUNC burn. This single transaction accounted for the majority of the monthly total, reinforcing Binance’s role as the largest individual contributor to the LUNC burn initiative.
Binance Leads January Burn Activity
On January 1, Binance burned 5,295,992,495 LUNC as part of its monthly LUNC burn program. Including additional on chain activity from the same day, total burns reached 5,367,757,097 LUNC, making it the highest burn day of the month by a wide margin.
While daily burns following January 1 were smaller in comparison, they remained consistent throughout the month, reflecting steady on chain usage and continued community participation.
January 2026 LUNC Daily Burn Recap
Month
Date
LUNC Burn
January
1
5,367,757,097
January
2
36,700,121
January
3
194,515,792
January
4
59,068,461
January
5
22,184,507
January
6
55,976,794
January
7
58,298,205
January
8
85,060,487
January
9
22,167,180
January
10
22,949,053
January
11
34,617,148
January
12
33,911,987
January
13
18,745,561
January
14
35,139,054
January
15
16,451,097
January
16
29,576,801
January
17
12,733,630
January
18
17,668,179
January
19
45,755,919
January
20
29,137,485
January
21
25,392,519
January
22
38,485,760
January
23
19,364,345
January
24
17,237,217
January
25
31,182,257
January
26
37,348,523
January
27
20,630,370
January
28
34,338,338
Total
6,422,393,887
What This Means for Terra Classic
Although the majority of January’s burn volume came from Binance’s monthly contribution, consistent daily burns indicate ongoing network activity. Long term supply reduction will ultimately depend on increased on chain usage, broader adoption, and additional utility across the Terra Classic ecosystem.
As January continues, the community will be watching closely to see whether burn momentum can be sustained beyond large exchange driven events.
Realistic LUNC Price Projections During Altseason Based on Current Supply
Introduction
As altseason approaches, price speculation often increases across the crypto market. For Terra Classic LUNC, many projections circulate without properly considering circulating supply and market capitalization. This leads to unrealistic expectations and confusion among investors.
This article presents a clear and realistic projection for LUNC price scenarios during a potential altseason, using simple market cap logic and current supply data. Token burns are intentionally excluded to keep assumptions conservative and grounded.
Current LUNC Market Overview
At the time of writing, LUNC is trading under the following conditions.
Current price: $0.00003782
Circulating supply: 5,469,187,566,173 LUNC
Total supply: 6,470,319,288,377 LUNC
Market capitalization: Approximately $206,964,455
All projections below assume the circulating supply remains unchanged.
LUNC Price Scenarios Explained With Market Capitalization
$0.0001 Price Scenario
Metric
Value
LUNC Price
$0.0001
Estimated Market Capitalization
$546,918,756
Gain From Current Price
Approximately 165 percent
A move to $0.0001 would place LUNC just below a $550 million market capitalization. This level is well within reach during a moderate altseason, particularly if overall market sentiment improves and trading volume increases.
This scenario represents a conservative upside and does not require major ecosystem changes or extraordinary adoption.
$0.001 Price Scenario
Metric
Value
LUNC Price
$0.001
Estimated Market Capitalization
$5,469,187,566
Gain From Current Price
Approximately 2,545 percent
At $0.001, LUNC would reach a market capitalization of approximately $5.47 billion. This would position it among well established mid cap cryptocurrencies.
This scenario could be achievable during a strong altseason supported by renewed market interest, improved on chain activity, or broader momentum across the crypto sector. While ambitious, it remains within historical norms for popular altcoins during peak cycles.
$0.01 Price Scenario
Metric
Value
LUNC Price
$0.01
Estimated Market Capitalization
$54,691,875,662
Gain From Current Price
Approximately 14,400 percent
A price of $0.01 would push LUNC’s market capitalization above $54 billion. At this level, LUNC would need to compete with top tier blockchain networks in terms of relevance, adoption, and ecosystem depth.
Without significant structural improvements or widespread real world utility, this scenario should be considered extremely optimistic.
$0.1 and $1 Price Scenarios
LUNC Price
Estimated Market Capitalization
Market Assessment
$0.1
$546,918,756,617
Unrealistic
$1
$5,469,187,566,173
Virtually impossible
At $0.1, LUNC would exceed a $500 billion market capitalization. At $1, it would surpass $5 trillion. These valuations are larger than most historical crypto market leaders and, in the case of $1, exceed the total crypto market capitalization seen at previous cycle peaks.
Under current market conditions and without substantial supply reduction, these price levels are not considered realistic.
What Is the Highest Realistic Price for LUNC in Altseason
Based on circulating supply, historical market behavior, and comparative altcoin valuations, the most realistic upper range for LUNC during a strong altseason lies between $0.0001 and $0.001.
Among these, $0.001 stands out as the highest plausible target. Reaching this level would represent a gain of roughly 25 times from the current price, or approximately 2,500 percent.
This target does not rely on extreme assumptions and aligns with what has been observed in previous altcoin market cycles.
Final Thoughts
Price projections are most meaningful when grounded in supply and market capitalization rather than emotion or hype. While higher prices are mathematically possible, only certain levels align with realistic market conditions.
For LUNC, a move toward the $0.001 range would already represent a major altseason success. Expectations beyond that level should be approached with caution unless fundamental changes significantly alter the network’s valuation profile.
Many community members keep asking the same question: how long does it take to burn 1 trillion LUNC?
To answer this, we use simple math based on real on chain data, not assumptions or price speculation.
This analysis reflects historical burn performance only.
Before reviewing the numbers, it is important to understand that LUNC is burned through two mechanisms.
The first is on chain transaction burns, which come from real network usage such as transfers and smart contract interactions.
The second is direct wallet burns, where LUNC is manually sent to the burn wallet by individuals, exchanges, or organizations.
Both burn sources are calculated separately to keep the analysis transparent.
Time Period Covered
Description
Duration
Burn start date
May 13, 2022
End date
January 28, 2026
Total duration
1,356 days
Total LUNC Burned
Burn Source
Total Burned
On chain transactions
84.49 billion LUNC
Direct wallet burns
352.57 billion LUNC
Total burned
437.06 billion LUNC
This clearly shows that most LUNC burns so far come from direct wallet burns rather than organic network activity.
Average Daily Burn Rate
Using a total duration of 1,356 days, the average daily burn rate can be calculated.
Total burn rate including all sources:
437.06 billion LUNC divided by 1,356 days equals approximately 322.4 million LUNC burned per day.
On chain transaction burns only:
84.49 billion LUNC divided by 1,356 days equals approximately 62.3 million LUNC burned per day.
Time Required to Burn 1 Trillion LUNC
Burn Scenario
Days Required
Years Required
All burn sources
3,101 days
Approximately 8.5 years
On chain only
16,048 days
Approximately 43.9 years
Projection Breakdown
Burn Scenario
Days
Months
Years
All burn sources
3,101
About 102 months
About 8.5 years
On chain only
16,048
About 528 months
About 43.9 years
Key Observations
More than eighty percent of all LUNC burned so far comes from direct wallet burns.
On chain transaction burns alone are too slow to significantly reduce supply within a reasonable timeframe.
Without a major increase in real network usage, utility, and transaction volume, the burn rate will remain limited.
This analysis shows that sustainable supply reduction depends on stronger on chain activity rather than voluntary burns.
An altcoin season refers to a market phase where most altcoins consistently outperform Bitcoin over a sustained period. This usually happens after Bitcoin completes a strong upward move and capital begins rotating into alternative cryptocurrencies.
When the Last Altcoin Season Occurred
The last confirmed and market wide altcoin season took place in 2021. It remains the clearest example of a full altcoin cycle in recent crypto history.
Key Characteristics of the 2021 Altcoin Season
Bitcoin led the market with a major rally before slowing down
Capital rotated from Bitcoin into Ethereum and then into altcoins
Bitcoin dominance declined steadily
A broad range of altcoins outperformed Bitcoin, not just a few sectors
Timeframe of the Last Altcoin Season
Began in early 2021
Peaked between February and November 2021
Ended as market momentum weakened toward the end of the year
Market Performance During 2021
Ethereum reached new all time highs
Layer 1 and Layer 2 projects saw strong growth
Decentralized finance and non fungible token sectors expanded rapidly
Retail participation increased across the entire altcoin market
What Happened After 2021
2022 entered a prolonged bear market
Overall crypto activity declined sharply
No sustained altcoin outperformance occurred
Altcoin Activity in 2023
Selective rallies appeared in specific sectors
Artificial intelligence and scaling solutions gained temporary attention
Bitcoin dominance remained strong
These conditions did not meet altcoin season criteria
Market Conditions in 2024 and 2025
Bitcoin and Ethereum continued to lead price action
Some altcoins performed well individually
Broad market rotation into altcoins did not occur
This phase is better defined as a transition period
Key Indicators of a True Altcoin Season
Bitcoin completes a strong upward move
Bitcoin dominance peaks and begins to decline
Altcoins outperform Bitcoin across multiple sectors
Momentum lasts for several months
Conclusion
The last full and confirmed altcoin season occurred in 2021. Since then, the market has experienced recovery phases and limited altcoin rallies, but not a complete and sustained shift away from Bitcoin dominance. Understanding these cycles helps investors distinguish between short term hype and true market trends.
Did You Know Only 1 Billion LUNC Was Burned in January Through On Chain Activity
As January comes to an end, it is important for the Luna Classic community to re evaluate the current state of on chain burn activity. Many community members focus on total burn numbers, but a closer look shows that on chain activity remains relatively weak.
In January, the total amount of LUNC burned through on chain related activity reached over 6.3 billion LUNC. While this may sound significant at first glance, the daily burn rate throughout the month struggled to consistently pass 100 million LUNC per day. This highlights ongoing challenges in driving strong on chain usage and transaction volume.
A major factor that impacts monthly burn totals is Binance. During January, Binance burned approximately 5,295,992,495 LUNC as part of its monthly LUNC burn program. This burn was generated from LUNC trading fees collected on Binance during December 2025.
If the Binance burn is excluded, the remaining LUNC burned so far is just over 1 billion. Even this figure does not come entirely from pure on chain activity. Some burns are contributed by validators, projects, wallets, and exchanges. However, these contributions remain relatively small. For simplicity, the remaining amount can be viewed as largely representing on chain activity.
The data below shows the daily LUNC burn figures recorded throughout January.
Month
Date
LUNC Burn
January
1
71,764,602
January
2
36,700,121
January
3
194,515,792
January
4
59,068,461
January
5
22,184,507
January
6
55,976,794
January
7
58,298,205
January
8
85,060,487
January
9
22,167,180
January
10
22,949,053
January
11
34,617,148
January
12
33,911,987
January
13
18,745,561
January
14
35,139,054
January
15
16,451,097
January
16
29,576,801
January
17
12,733,630
January
18
17,668,179
January
19
45,755,919
January
20
29,137,485
January
21
25,392,519
January
22
38,485,760
January
23
19,364,345
January
24
17,237,217
January
25
31,182,257
January
26
37,348,523
Total
1,071,432,684
Overall, January data shows that on chain burn activity remains modest. While exchange driven burns such as Binance play a major role in reducing supply, long term sustainability depends on stronger on chain usage. Increased transactions, real applications, and broader ecosystem growth are essential to improving daily burn rates and supporting the future of the Luna Classic network.
Nearly 800,000 USTC Burned in the Last 26 Days as Community Efforts Continue
The Terra Classic community continues to show steady commitment to supply reduction as nearly 800,000 USTC tokens have been burned over the past 26 days. According to on chain data, a total of 786,277 USTC has been removed from circulation between January 1 and January 26.
Token burning remains one of the key mechanisms used by the community to reduce circulating supply and support long term recovery efforts. While daily burn amounts vary, the overall trend highlights consistent participation and ongoing activity across the Terra Classic ecosystem.
Several days recorded notable spikes in burn volume, particularly on January 2, January 10, and January 19. These higher burn days contributed significantly to the monthly total and reflect moments of increased community engagement.
Daily USTC Burn Data
Month
Date
USTC Burn
January
1
33,407
January
2
93,158
January
3
15,065
January
4
7,253
January
5
15,637
January
6
7,618
January
7
9,758
January
8
33,196
January
9
58,758
January
10
115,023
January
11
8,474
January
12
7,387
January
13
18,707
January
14
6,542
January
15
9,397
January
16
9,043
January
17
8,298
January
18
5,860
January
19
131,816
January
20
17,210
January
21
44,796
January
22
77,570
January
23
10,421
January
24
14,897
January
25
13,725
January
26
13,261
Total
786,277
What This Means for Terra Classic
Consistent USTC burning demonstrates sustained community involvement and reinforces long term supply management goals. While the burn volume alone does not determine price movement, it plays an important role in strengthening confidence and transparency within the ecosystem.
As the Terra Classic network continues to evolve, ongoing burn activity remains a positive signal of collaboration between validators, developers, and community members.
Luna Classic Burn Rate Continues to Decline as Daily Burns Stay Below 50 Million LUNC Per Day
The Luna Classic burn rate continued to decline throughout January 2026, with daily burns struggling to reach 50 Million LUNC per day over the past 18 days. This slowdown is mainly caused by reduced on chain activity across the network.
Token burning remains a key mechanism for lowering LUNC supply and supporting long term ecosystem recovery. However recent data shows that most daily burns are relatively small, reflecting weak transaction volume and limited network usage.
On chain activity plays a direct role in burn performance. When transactions decrease, fewer fees are collected and fewer tokens are removed from circulation. As a result, organic burns generated by daily network usage remain low.
Despite the decline in daily burn rates, January 2026 still recorded a large total burn figure due to external contributions.
Daily LUNC Burn Recap for January 2026
Month
Date
LUNC Burned
January
1
5,367,757,097
January
2
36,700,121
January
3
194,515,792
January
4
59,068,461
January
5
22,184,507
January
6
55,976,794
January
7
58,298,205
January
8
85,060,487
January
9
22,167,180
January
10
22,949,053
January
11
34,617,148
January
12
33,911,987
January
13
18,745,561
January
14
35,139,054
January
15
16,451,097
January
16
29,576,801
January
17
12,733,630
January
18
17,668,179
January
19
45,755,919
January
20
29,137,485
January
21
25,392,519
January
22
38,485,760
January
23
19,364,345
January
24
17,237,217
January
25
31,182,257
January
26
37,348,523
Total
6,367,425,179
Binance Contribution Dominates Monthly Burns
Although more than 6.36 billion LUNC were burned in January 2026, most of this amount did not come from daily on chain activity. Approximately 5.29 billion LUNC were burned through Binance’s monthly LUNC burn program.
This means organic burns generated by the Luna Classic network itself remain relatively low. Without stronger ecosystem usage and higher transaction volume, daily burn levels are unlikely to improve significantly.
Outlook for Luna Classic
The current data highlights the importance of real network growth. Increased application usage, higher transaction activity, and broader community participation are necessary to support sustainable and consistent LUNC burns.
While centralized burn programs continue to play an important role, long term supply reduction will depend on organic on chain demand.
Why Buy and Hold Remains the Strongest Strategy for Long Term LUNC Investors
Binance founder Changpeng Zhao, widely known as CZ, has stated that very few trading strategies consistently outperform the simple buy and hold approach. His message is clear. For most people, long term patience beats short term trading.
This perspective is especially relevant for the Terra Classic community. As LUNC prices decline to around 0.000037 dollars, many community members feel discouraged. Falling prices can affect investor confidence and create fear about the future of LUNC.
It is important to understand that not everyone in the LUNC ecosystem is a trader or a builder. The majority of community members are investors. When prices continue to decline, emotional decisions often lead to panic selling. In many cases, this results in investors locking in losses and losing the long term value of their investment.
For investors, the buy and hold strategy may be the most suitable approach. Below are the key reasons why this strategy often delivers better outcomes.
Buy and Hold Reduces Emotional Decisions
Crypto markets move quickly and emotions often drive poor decisions. Fear during price drops and greed during price spikes cause many investors to buy high and sell low.
Buy and hold removes constant decision making. Investors focus on the long term vision rather than short term price movements. This reduces stress and helps avoid costly emotional mistakes.
Time in the Market Matters More Than Timing the Market
Trying to predict the perfect time to buy or sell is extremely difficult. Even professional traders struggle to do this consistently.
Long term investors benefit from staying in the market during recovery phases and growth cycles. Missing just a few strong price recovery days can significantly reduce overall returns. Buy and hold ensures investors remain positioned when momentum returns.
Lower Fees and Fewer Losses
Frequent trading comes with transaction fees, slippage, and execution errors. Over time, these costs slowly reduce capital.
Buy and hold minimizes these expenses. Investors enter the market once and allow their investment to grow without constant deductions. This allows compounding to work more effectively over time.
LUNC Development Is a Long Term Process
The Terra Classic ecosystem continues to evolve through network upgrades, infrastructure improvements, and community driven initiatives. These developments do not reflect instantly in price.
Long term value often follows sustained development, ecosystem growth, and renewed confidence. Buy and hold investors position themselves to benefit from these long term improvements rather than reacting to short term volatility.
Buy and Hold Fits Most Investors
While active trading may work for a small number of highly skilled professionals, most retail investors struggle to outperform the market.
Buy and hold is not about doing nothing. It is about choosing a strategy that aligns with long term growth, reduces mistakes, and protects mental well being.
For the majority of LUNC investors, patience and discipline offer a stronger foundation than constant trading.
Final Thoughts
Price declines can test confidence and patience, especially during uncertain market conditions. However, history shows that long term investors who avoid panic selling often achieve better results.
As CZ has pointed out, very few strategies beat buy and hold. For LUNC investors focused on the future rather than short term price action, this approach may offer clarity, stability, and long term opportunity.
Luna Classic Price Hits January Low as Bitcoin Drops to 86000 Dollars
The cryptocurrency market experienced a sudden shock after Bitcoin dropped sharply to the 86000 dollar price level. This unexpected move caused widespread selling across the market and pushed many altcoins lower, including Luna Classic.
The drop in Bitcoin price caught many investors by surprise and quickly affected overall market sentiment. As Bitcoin leads the broader crypto market, most digital assets followed the same downward trend within hours.
Market Reaction and Possible Causes
Some members of the crypto community believe the sudden decline was linked to uncertainty around the United States government. Concerns have grown over a potential government shutdown next week, as the Clarity Act has not yet passed. This uncertainty appears to have added pressure to an already fragile market.
While no official confirmation links the price drop directly to political events, fear and speculation played a major role in accelerating sell offs across major cryptocurrencies.
Luna Classic Reaches Lowest Price in January
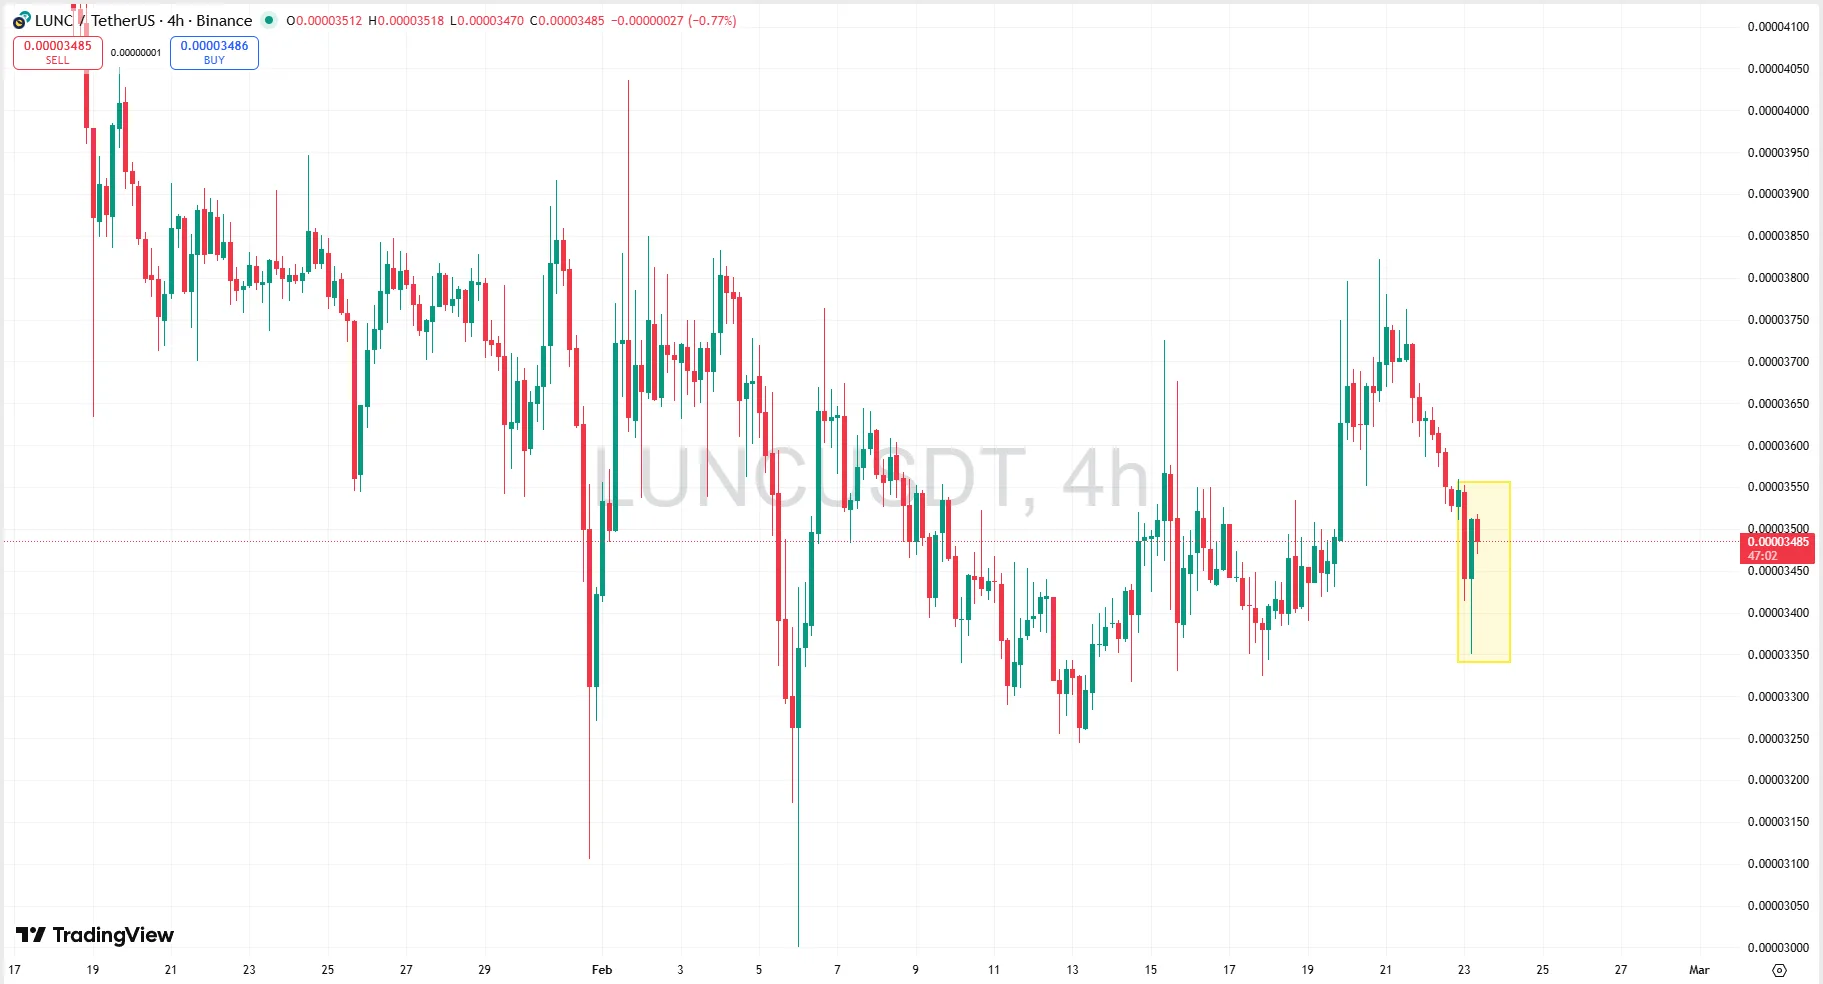
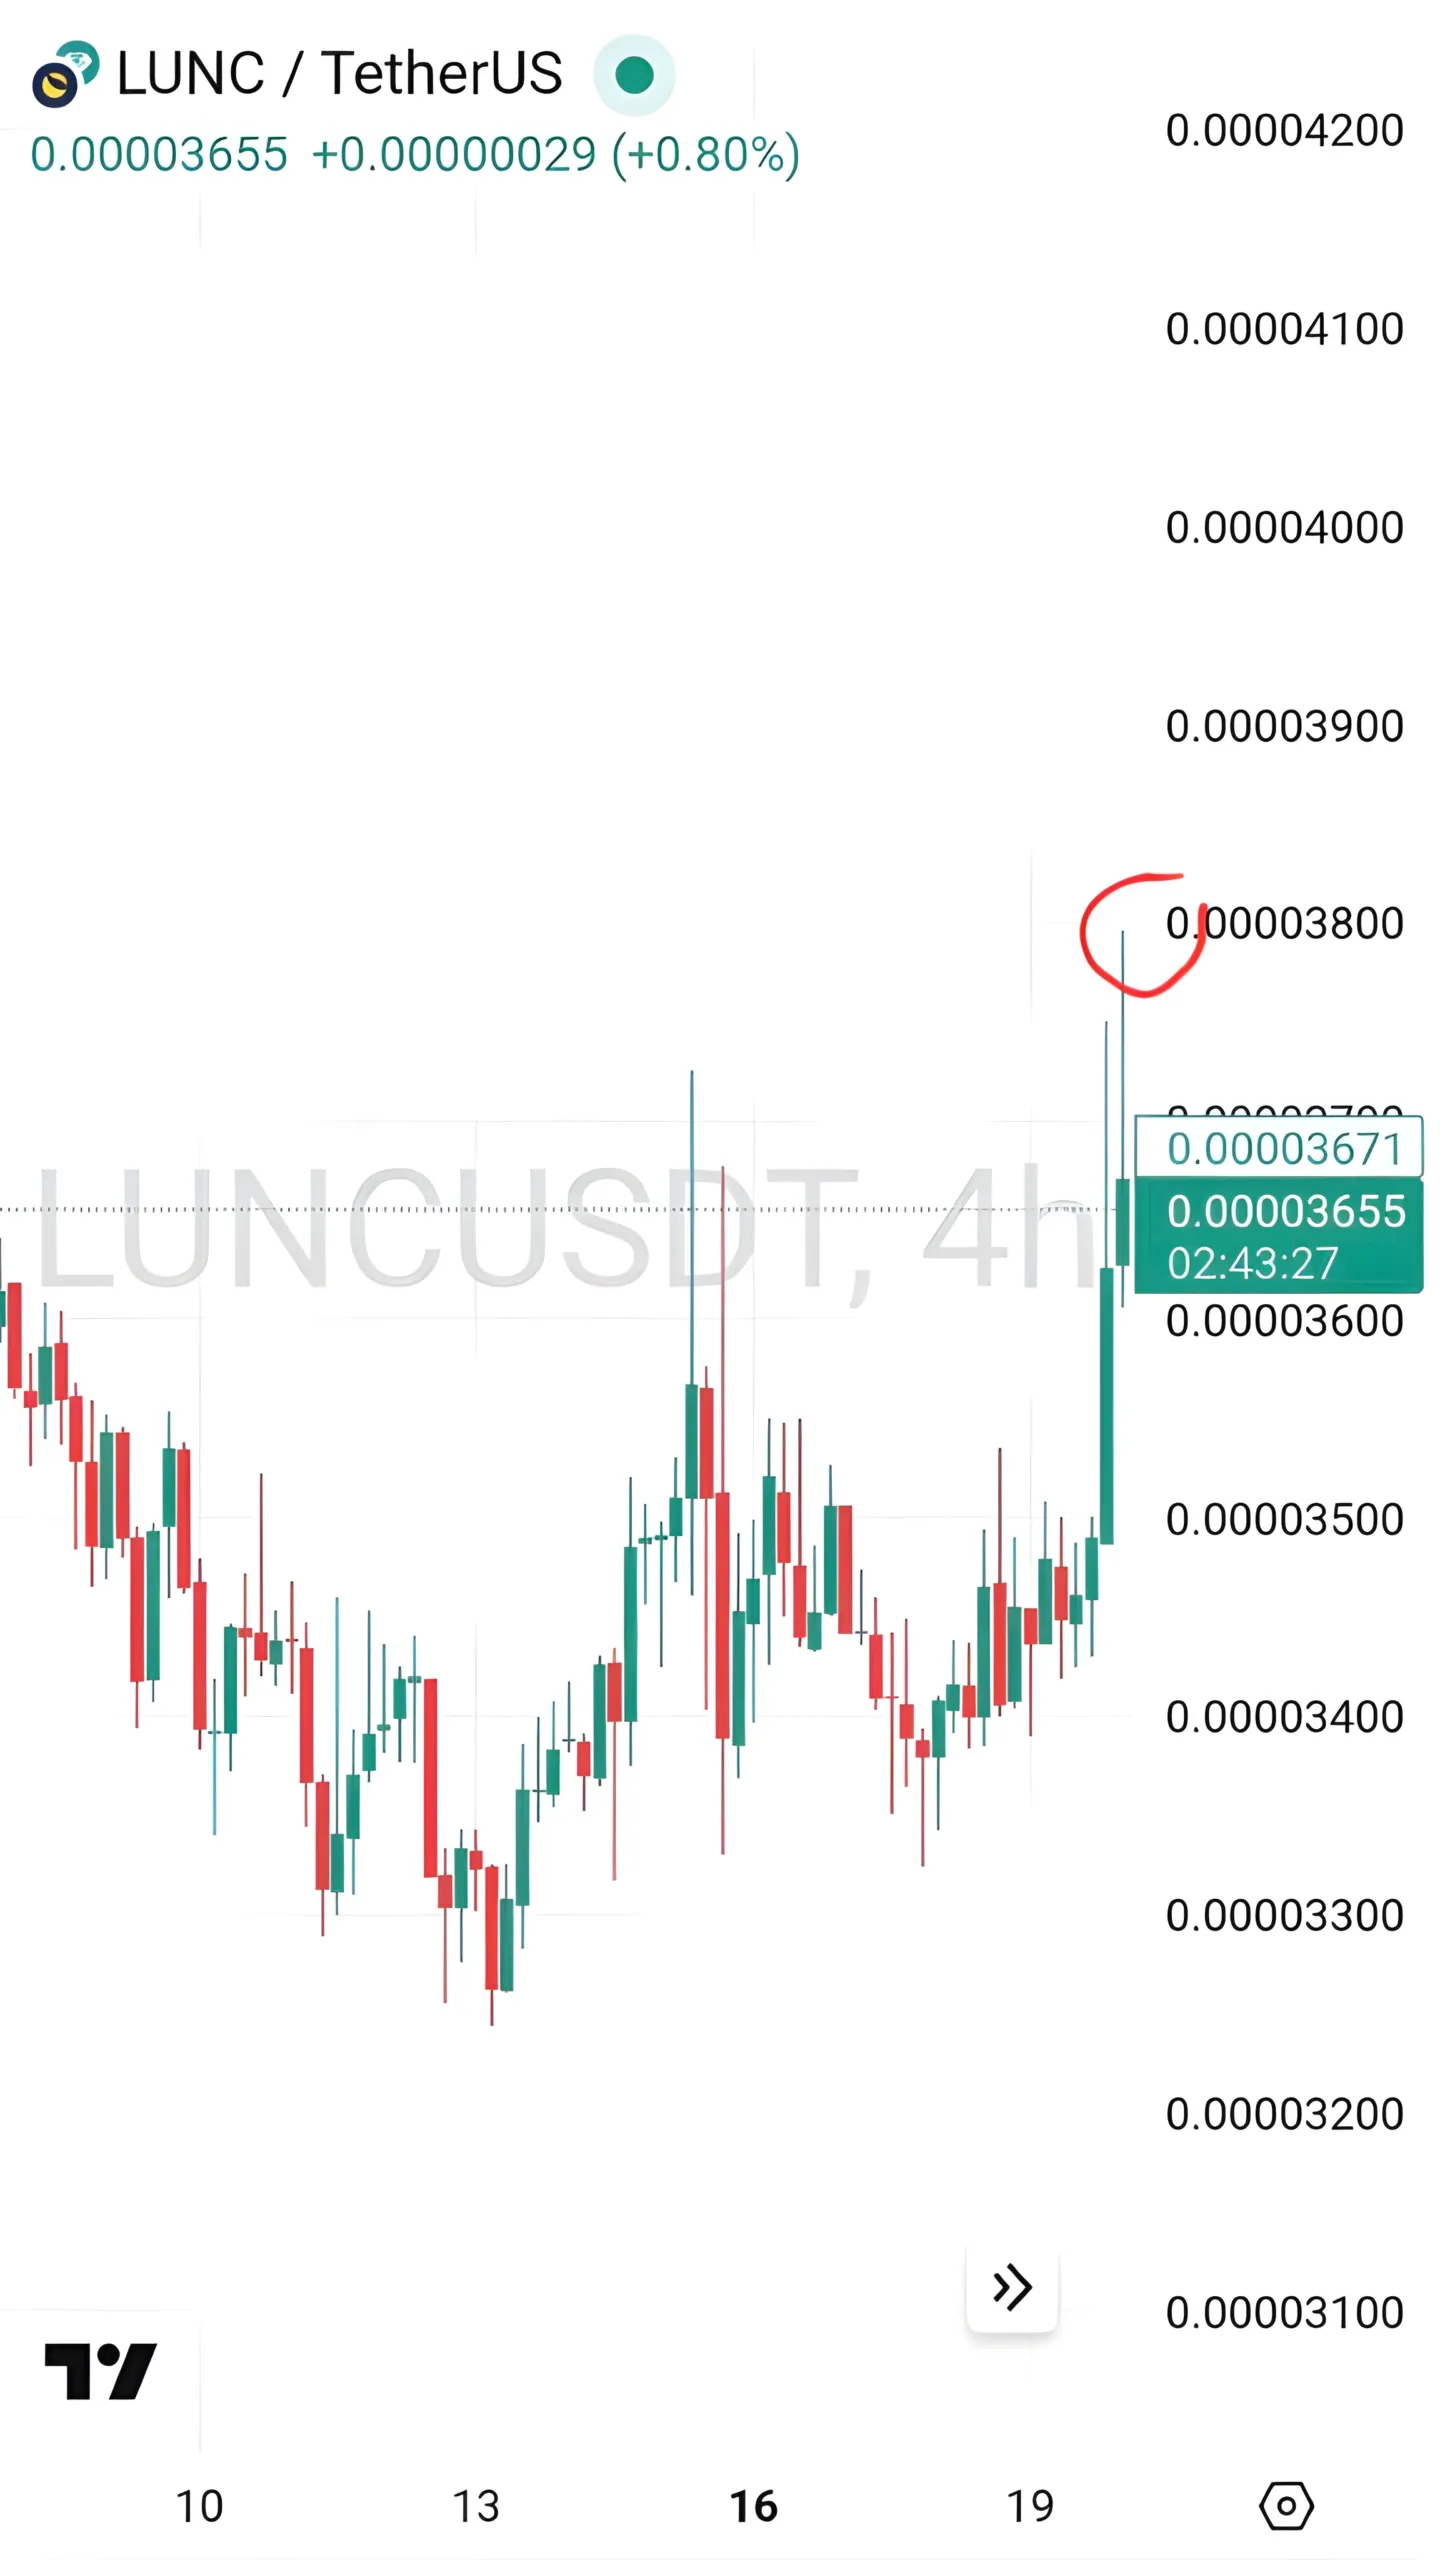
As Bitcoin fell, Luna Classic also moved lower and reached a price of 0.000035 dollars. This marked the lowest price level for LUNC in January 2026. The decline reflected the broader market movement rather than any specific issue within the Terra Classic ecosystem.
Despite the drop, trading activity remained active, showing that interest in Luna Classic continues even during periods of high volatility.
Early Signs of Recovery
Following the initial decline, Luna Classic has started to show early signs of recovery. At the time of writing, the LUNC price has risen to around 0.000037 dollars. This rebound suggests that some buyers are stepping back into the market as prices stabilize.
While market conditions remain uncertain, the recent price movement indicates that Luna Classic is attempting to recover alongside the broader crypto market.
Looking Ahead
The coming days may remain volatile as investors continue to react to macroeconomic and political developments. Bitcoin price movement will likely remain a key factor influencing Luna Classic and the wider crypto market.
As always, traders and investors are encouraged to stay informed and monitor market conditions closely.