

Market Context First (Very Important)
The recent LUNC drop is not an isolated event. Bitcoin falling toward 60K triggered a broad market selloff. When BTC drops fast, capital exits altcoins first. This creates exaggerated downside moves in smaller caps like LUNC.
So the current LUNC weakness is macro driven, not a project specific problem.
What This Chart Shows (4H timeframe)
1) Overall Trend
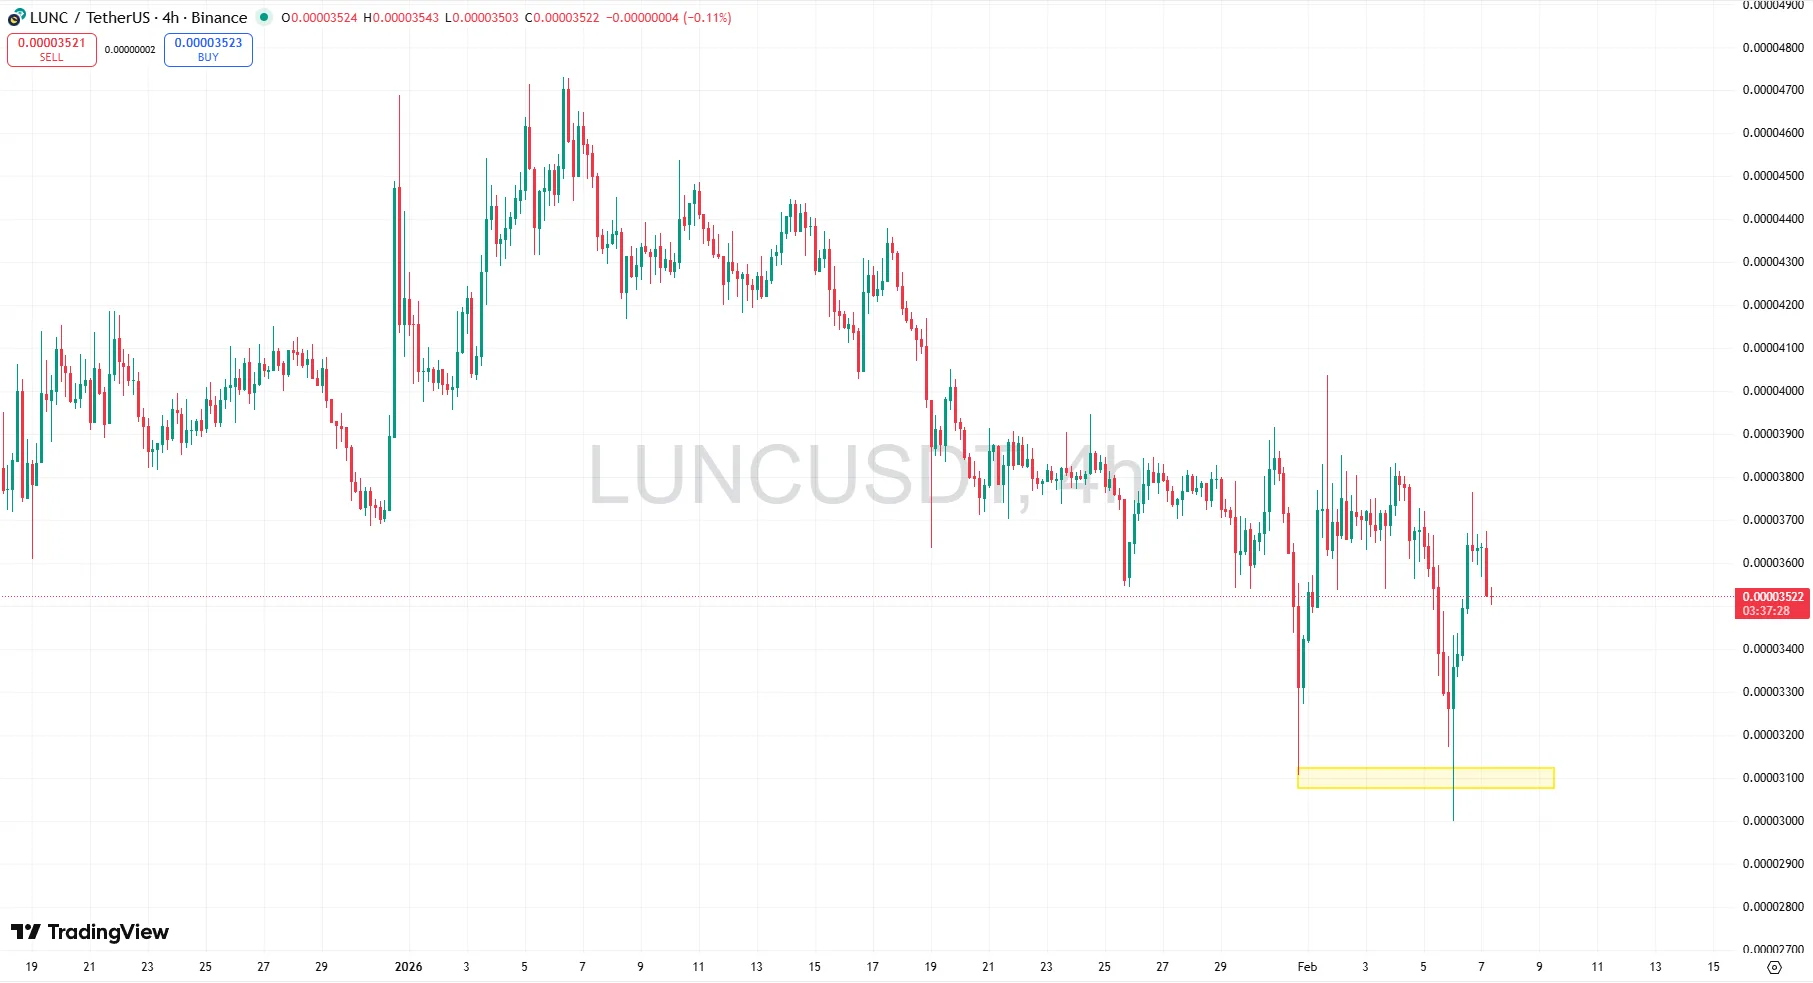
The chart shows a clear short term downtrend.
- Lower highs forming since the early January peak
- Lower lows forming progressively
- Price trading below previous support zones
This confirms LUNC is currently in a bearish market structure on the 4H timeframe.
2) The Most Important Area Right Now — Strong Support Zone
The highlighted zone marks a major demand area around 0.00003100 to 0.00003150.
Price bounced strongly from this area, and long wicks show aggressive buyers stepping in. This is the first real strong reaction after the selloff.
The sharp wick down followed by a bounce is called a liquidity sweep. The market pushed price down quickly to trigger stop losses, then buyers immediately bought the dip. This is often the first sign of accumulation.
3) Selling Pressure is Weakening
After the big drop, candles become smaller and price starts moving sideways. We see repeated bounces from the same zone. This tells us the panic selling phase is cooling down.
The market is moving from panic to stabilization. This phase is usually the beginning of a base formation.
4) Short Term Structure (What Happens Next)
LUNC is currently trapped in a range.
Resistance zone: 0.00003700 to 0.00003900
Support zone: 0.00003100 to 0.00003200
This is consolidation after a selloff. Markets almost always pause like this before the next big move.
5) Bullish Signals Starting to Appear
- Strong reaction at major support
- Liquidity sweep and fast recovery
- Sideways consolidation instead of continued dumping
- Selling momentum slowing
These are early accumulation characteristics. Reversals do not start with pumps. They start with sideways movement, which is what we are seeing.
6) What Needs to Happen for Confirmation
For a real recovery, LUNC needs to break and hold above 0.00003900.
If that happens, the downtrend structure breaks and momentum can shift bullish. Until then, this is still a recovery phase, not a confirmed uptrend.
Simple Summary for Beginners
Bitcoin dropped and the entire crypto market followed. LUNC also fell but found strong buyers at support.
Right now selling is slowing down, buyers are defending a key zone, and price is stabilizing. This is the early stage of a potential reversal, but confirmation still needs a breakout.
If Bitcoin stabilizes, this chart suggests LUNC is preparing for its next move rather than continuing a crash.