Home Blog Page 21

Over 1.6 Billion LUNC Already Burned in Just 8 Days

0

Over 1.6 Billion LUNC Already Burned in Just 8 Days

The Terra Classic community continues to push forward with supply reduction efforts. In the first eight days of February, more than 1.6 billion LUNC has already been permanently removed from circulation.

Token burning remains one of the most important long term strategies for Terra Classic. The goal is simple and clear. Reduce the circulating supply over time and support the network recovery.

February Daily LUNC Burn Breakdown

  • February 1: 1,147,191,675 LUNC
  • February 2: 168,648,532 LUNC
  • February 3: 55,419,874 LUNC
  • February 4: 138,464,391 LUNC
  • February 5: 36,216,303 LUNC
  • February 6: 48,908,522 LUNC
  • February 7: 20,794,946 LUNC
  • February 8: 32,404,845 LUNC

Total burned: 1,648,049,088 LUNC

Strong Start to the Month

The majority of the burn occurred on February 1, which alone accounted for more than 1.14 billion LUNC. This large burn significantly boosted the monthly total and highlights how periodic large burns can accelerate the overall supply reduction.

The following days continued to contribute steady daily burns, showing ongoing network activity and community participation.

Why Burning Still Matters

The Terra Classic ecosystem remains focused on long term recovery. Reducing supply is a gradual process, but consistent burns demonstrate commitment from the community and supporting platforms.

Every burn helps move the ecosystem closer to a healthier supply level. While the process takes time, sustained activity like this keeps momentum strong.

Looking Ahead

With more than 1.6 billion LUNC already burned in the first week of February, the month has started with strong progress. If this pace continues, February could become another important milestone in the Terra Classic burn journey.

LUNC Price Analysis: Early Signs of Stabilization After Market Selloff

0

Market Context First (Very Important)

The recent LUNC drop is not an isolated event. Bitcoin falling toward 60K triggered a broad market selloff. When BTC drops fast, capital exits altcoins first. This creates exaggerated downside moves in smaller caps like LUNC.

So the current LUNC weakness is macro driven, not a project specific problem.

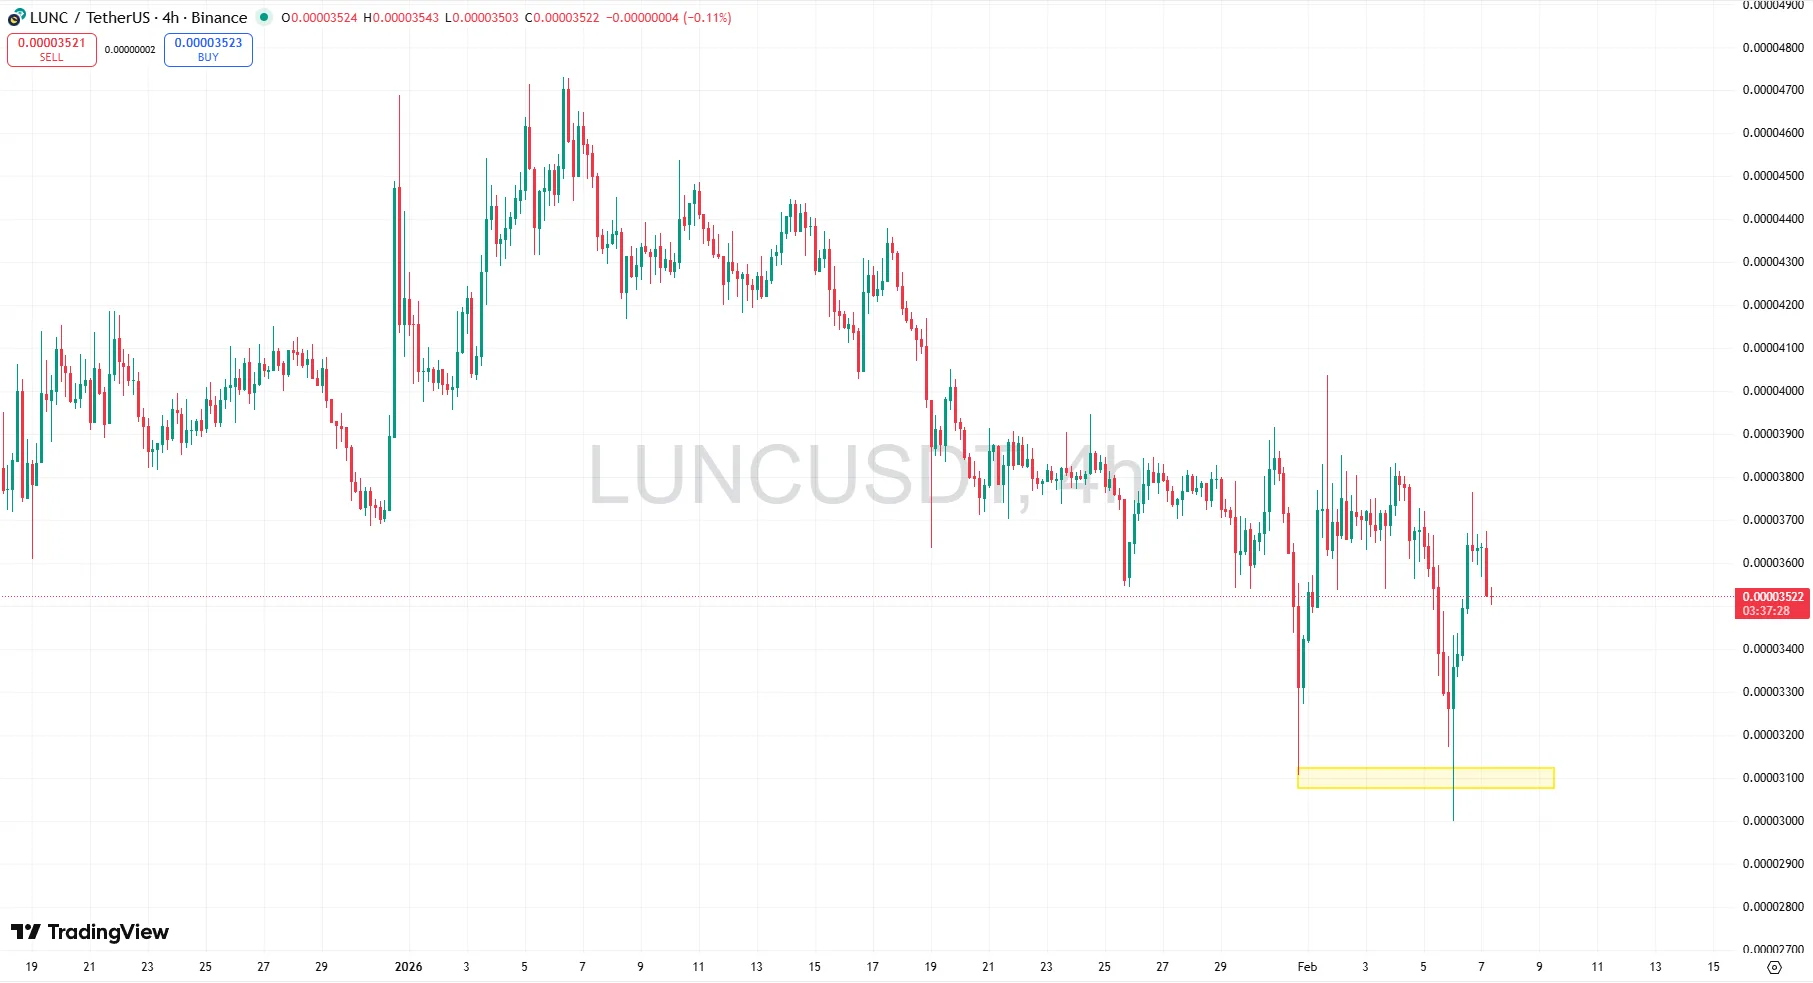
What This Chart Shows (4H timeframe)

1) Overall Trend

The chart shows a clear short term downtrend.

  • Lower highs forming since the early January peak
  • Lower lows forming progressively
  • Price trading below previous support zones

This confirms LUNC is currently in a bearish market structure on the 4H timeframe.

2) The Most Important Area Right Now — Strong Support Zone

The highlighted zone marks a major demand area around 0.00003100 to 0.00003150.

Price bounced strongly from this area, and long wicks show aggressive buyers stepping in. This is the first real strong reaction after the selloff.

The sharp wick down followed by a bounce is called a liquidity sweep. The market pushed price down quickly to trigger stop losses, then buyers immediately bought the dip. This is often the first sign of accumulation.

3) Selling Pressure is Weakening

After the big drop, candles become smaller and price starts moving sideways. We see repeated bounces from the same zone. This tells us the panic selling phase is cooling down.

The market is moving from panic to stabilization. This phase is usually the beginning of a base formation.

4) Short Term Structure (What Happens Next)

LUNC is currently trapped in a range.

Resistance zone: 0.00003700 to 0.00003900
Support zone: 0.00003100 to 0.00003200

This is consolidation after a selloff. Markets almost always pause like this before the next big move.

5) Bullish Signals Starting to Appear

  • Strong reaction at major support
  • Liquidity sweep and fast recovery
  • Sideways consolidation instead of continued dumping
  • Selling momentum slowing

These are early accumulation characteristics. Reversals do not start with pumps. They start with sideways movement, which is what we are seeing.

6) What Needs to Happen for Confirmation

For a real recovery, LUNC needs to break and hold above 0.00003900.

If that happens, the downtrend structure breaks and momentum can shift bullish. Until then, this is still a recovery phase, not a confirmed uptrend.

Simple Summary for Beginners

Bitcoin dropped and the entire crypto market followed. LUNC also fell but found strong buyers at support.

Right now selling is slowing down, buyers are defending a key zone, and price is stabilizing. This is the early stage of a potential reversal, but confirmation still needs a breakout.

If Bitcoin stabilizes, this chart suggests LUNC is preparing for its next move rather than continuing a crash.

Did You Know LUNC Is the Only Coin Binance Burns Besides Its Native Token BNB

0

Did You Know? LUNC Is the Only Coin Binance Burns Besides Its Native Token BNB

Many crypto investors are familiar with Binance’s regular BNB burn events. However, fewer people realize that Terra Luna Classic (LUNC) is the only other cryptocurrency that Binance actively burns on a recurring basis. This initiative has been running since 2022 and has become one of the most significant supply reduction efforts in the Terra Luna Classic ecosystem.

The Origin of the LUNC Burn Program

Before the collapse of the Terra ecosystem, Binance was one of the major supporters and investors in Terra Luna and the UST stablecoin. After the crash, the original Terra Luna chain was rebranded as Terra Luna Classic, and UST became USTC.

In response to the collapse and the massive token supply that followed, Binance launched a monthly LUNC burn program. The goal was to support the community’s recovery efforts by reducing the circulating supply of LUNC.

How the Binance Burn Works

The Binance LUNC burn program uses trading fees generated from LUNC spot and margin trading pairs on the Binance platform.

At the beginning of the program, Binance committed to burning 100 percent of the trading fees collected from LUNC transactions. This approach significantly accelerated the burn rate and demonstrated Binance’s strong support for the Terra Luna Classic community.

Later, the community introduced a proposal requesting that part of the funds be redirected to support the community pool. As a result, Binance adjusted the program and now burns 50 percent of LUNC trading fees while continuing to support the ecosystem in other ways.

Over 82 Billion LUNC Burned Since 2022

Since the launch of the initiative, Binance has burned approximately 82.26 billion LUNC. This makes Binance the largest single contributor to LUNC burns globally.

The scale of this contribution highlights the long term commitment Binance has shown toward the Terra Luna Classic ecosystem and its recovery efforts.

Why This Matters for the LUNC Community

Token burns reduce the circulating supply of a cryptocurrency. In theory, a decreasing supply combined with stable or increasing demand can support long term price stability and growth.

For the LUNC community, Binance’s continued participation is seen as a major advantage. Aside from its native token BNB, LUNC remains the only cryptocurrency that Binance consistently burns, making this program a unique partnership between a major exchange and a community driven blockchain.

Conclusion

The Binance LUNC burn program remains one of the most important supply reduction mechanisms in the Terra Luna Classic ecosystem. With tens of billions of tokens already removed from circulation, the initiative continues to play a key role in the ongoing recovery and development of the LUNC community.

Over 550,000 USTC Burned in the Last 6 Days

0

Over 550,000 USTC Burned in the Last 6 Days as Supply Reduction Accelerates

The Terra Classic community continues to push forward with its supply reduction efforts as USTC burn activity shows steady momentum. Over the past six days, a total of 553,802 USTC has been permanently removed from circulation, reflecting ongoing commitment to restoring long term value within the ecosystem.

Burning tokens reduces the circulating supply, which is widely viewed as a key step toward improving the long term stability and sustainability of USTC. The latest burn recap shows a mix of consistent daily burns and one significant spike that drove the majority of the total reduction.

USTC Daily Burn Recap

Below is the breakdown of USTC burned during the six day period in February:

Month Date USTC Burned
February 1 32,646
February 2 25,778
February 3 22,360
February 4 397,058
February 5 38,305
February 6 37,655
Total 553,802

Why USTC Burns Matter

USTC burn initiatives are designed to gradually reduce excess supply and support the long term recovery of the Terra Classic ecosystem. Consistent burn activity signals continued engagement from the community and ecosystem contributors, reinforcing the broader strategy aimed at improving token economics.

While burn events alone do not determine market performance, they remain an important part of the long term roadmap. Ongoing participation and steady progress demonstrate that supply reduction remains a key priority for the ecosystem.

Looking Ahead

The latest six day burn milestone reinforces the ongoing commitment to reducing USTC supply. As burn activity continues, the community will be watching closely for further developments and additional milestones in the weeks ahead.

Sustained efforts like these play a central role in the long term recovery narrative surrounding Terra Classic and USTC.

Is Someone Systematically Trying to Destroy Crypto? The Evidence Begins to Connect

0

Is a Coordinated Narrative Attacking Crypto? Market Drop Sparks Speculation

In recent days, the crypto market has faced a wave of negative narratives circulating across social platforms. Bitcoin and the broader crypto market experienced a sharp decline, with Bitcoin falling to levels not seen in years. What makes this situation unusual is the absence of major fundamental or economic announcements that typically trigger moves of this scale.

This has led some market observers to question whether the sudden surge of negative narratives is coincidental or part of a coordinated effort to damage crypto sentiment.

A Sudden Shift in Online Narratives

Over a short period, several controversial claims about the crypto industry began spreading online. Many of these claims were shared by unknown or newly created accounts using similar messaging. While none of these claims have been supported by credible evidence, their rapid spread has contributed to growing uncertainty and fear in the market.

Claim One: Speculation About Bitcoin’s Creator

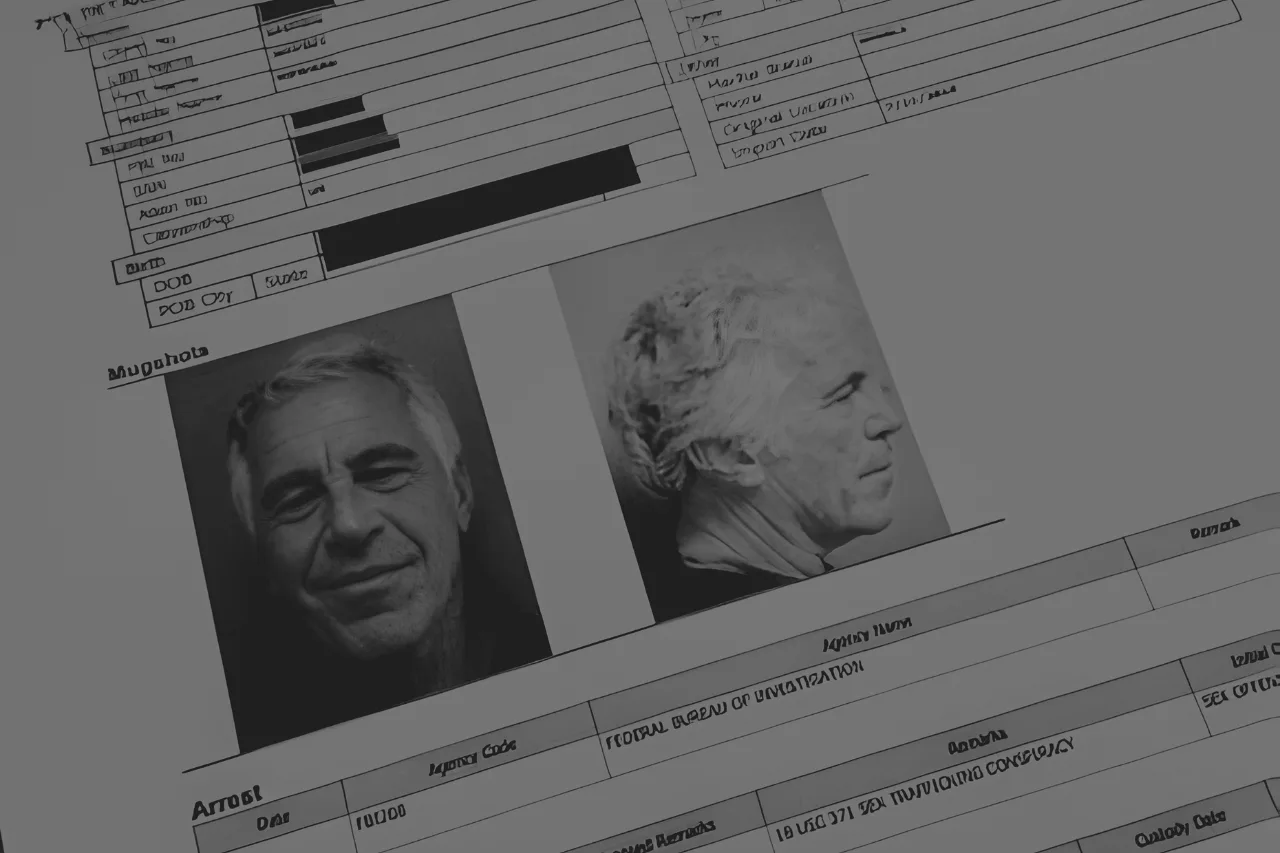
One widely circulated claim suggests that Satoshi Nakamoto, the creator of Bitcoin, was connected to Jeffrey Epstein. This narrative began circulating shortly after renewed public discussion around Epstein-related documents. However, no official or verified source has confirmed any connection between Epstein and Bitcoin’s creation.

Despite the lack of evidence, the narrative quickly gained traction online and contributed to negative sentiment toward the crypto space.

Claim Two: Accusations Targeting Binance and CZ

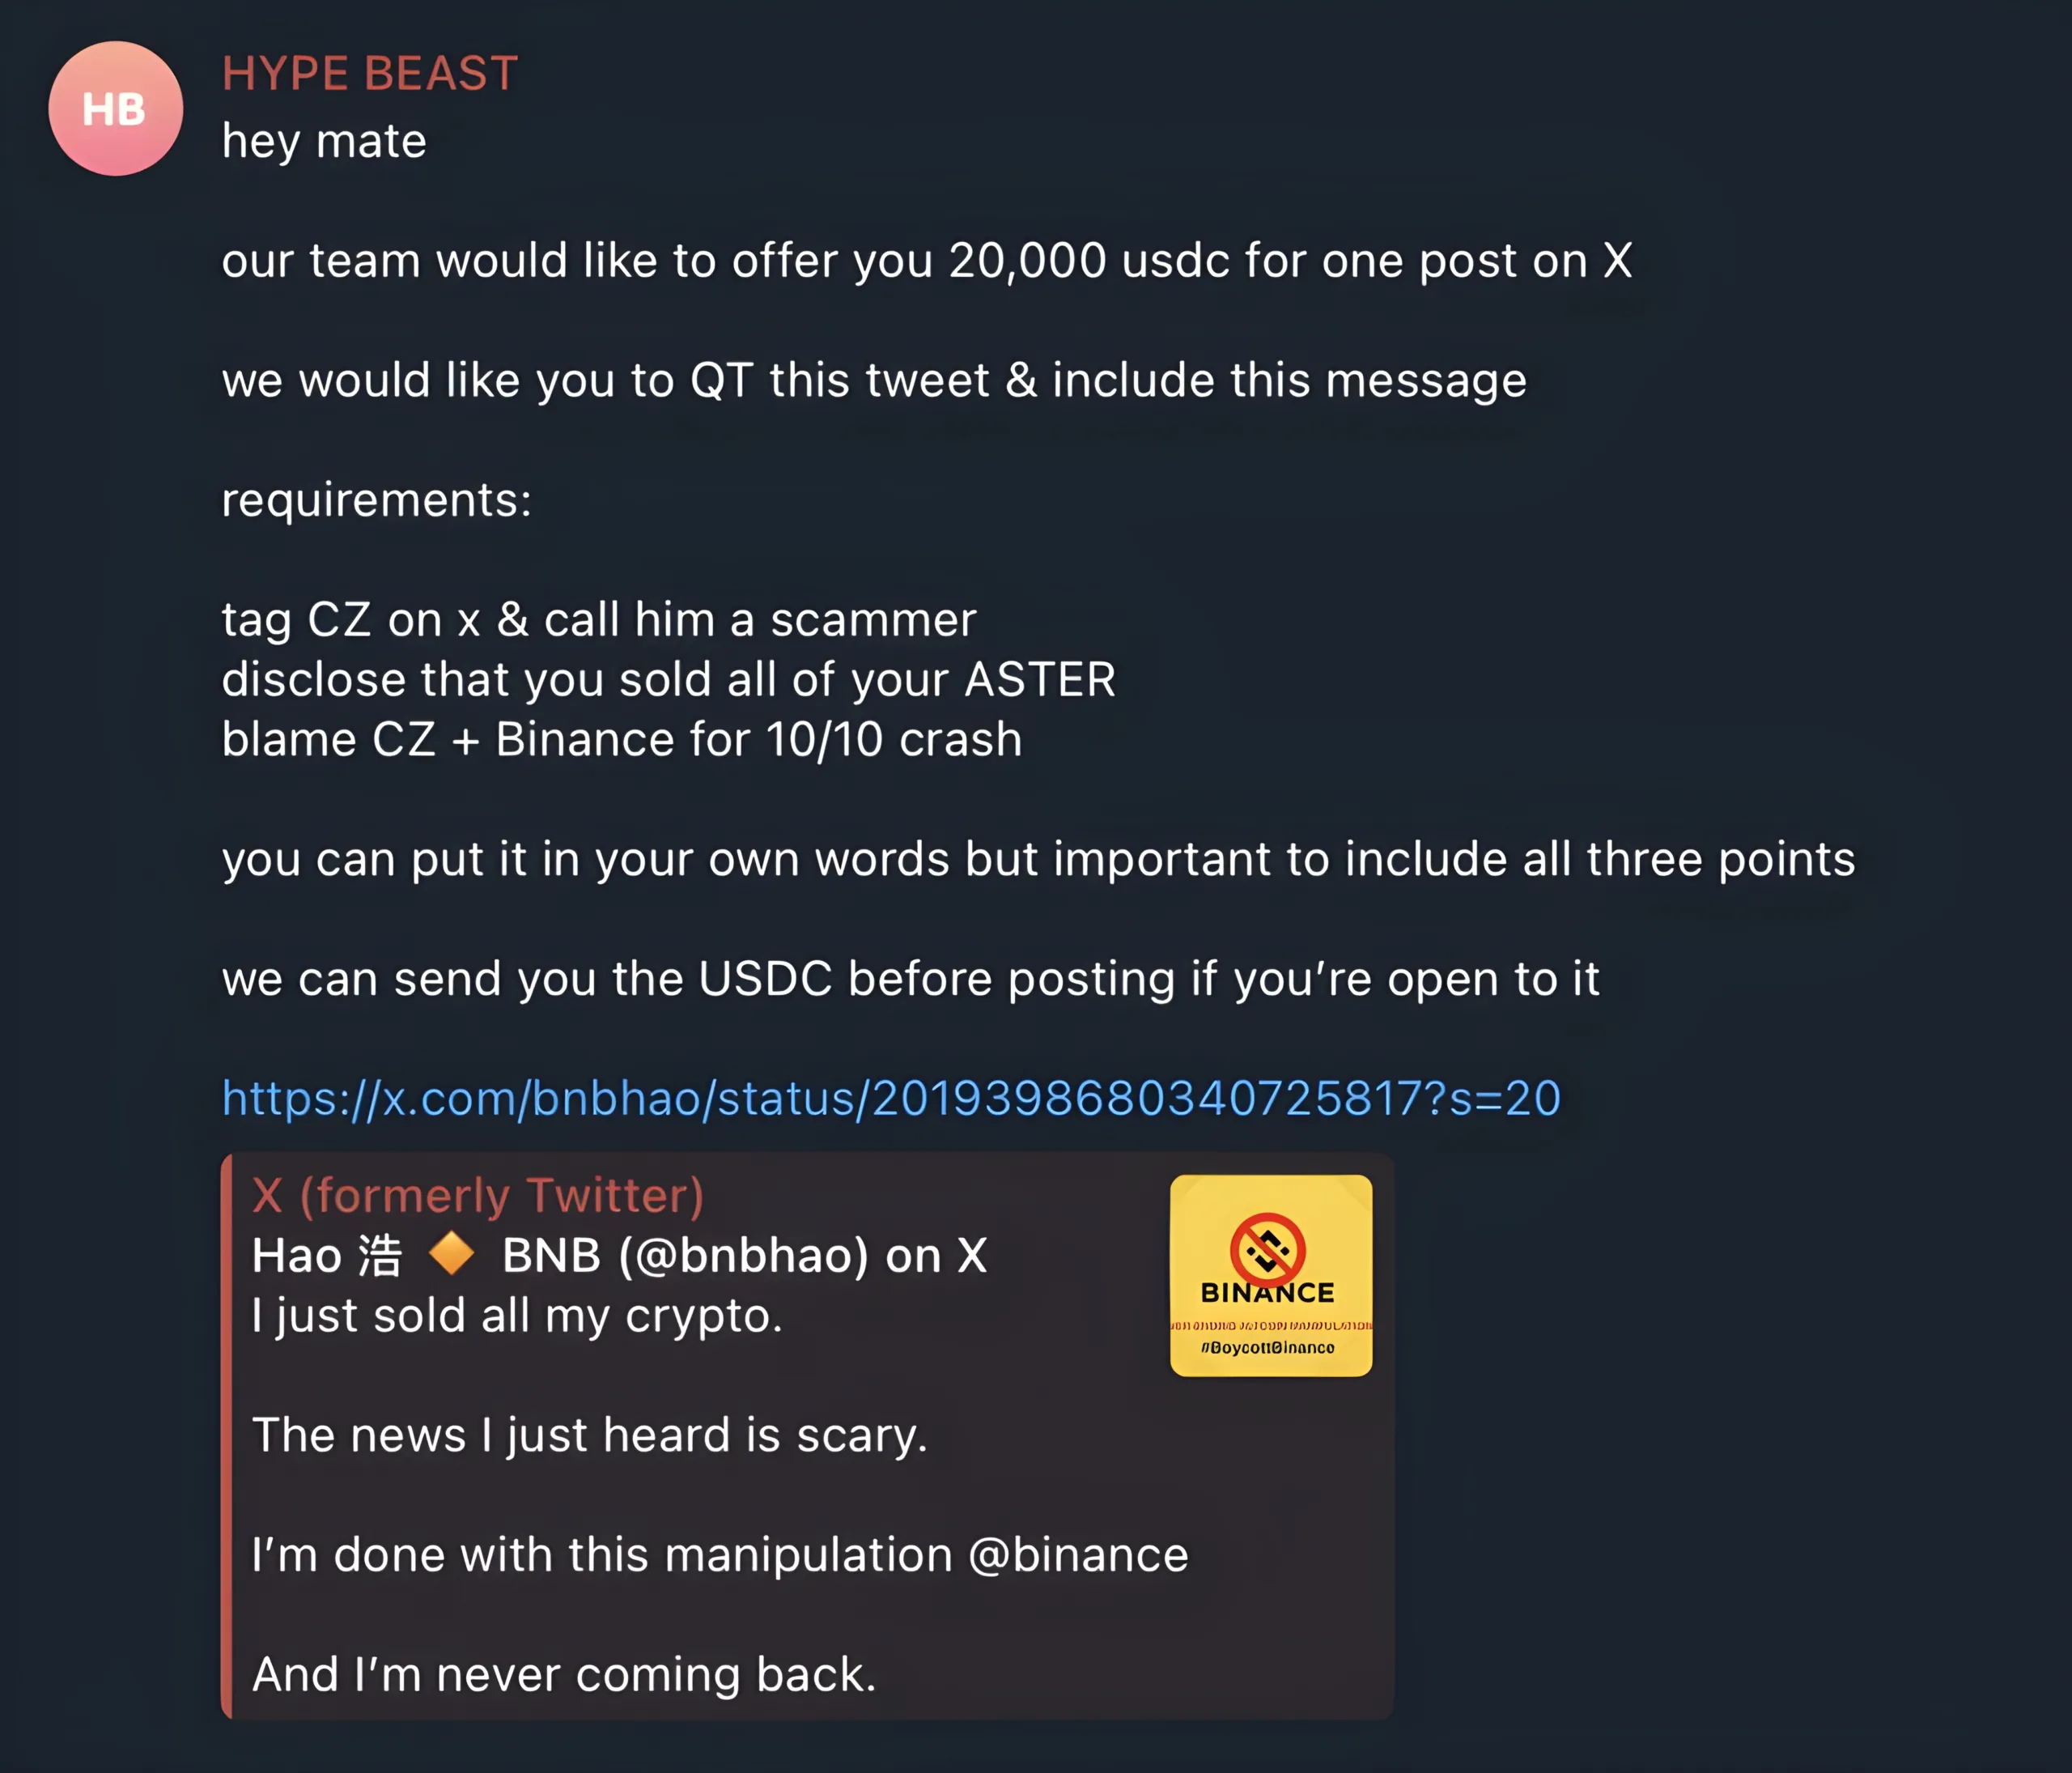
Another narrative focused on allegations that Binance and its former CEO Changpeng Zhao were responsible for manipulating the crypto market. These claims were often shared without verifiable proof and in some cases accompanied by alleged leaked or fabricated documents.

The rapid spread of these accusations has raised concerns about misinformation campaigns and the potential impact of false claims on public trust in the industry.

Lack of Major Economic Catalysts

Market participants typically expect large crypto price movements to follow significant macroeconomic events or major regulatory announcements. In this case, no major economic developments were reported that would normally explain such a sharp decline.

While discussions about a potential government shutdown appeared in the news cycle, there were no clear economic triggers that historically correlate with a major drop in Bitcoin’s price.

Market Sentiment and Uncertainty

The combination of negative narratives and the absence of clear economic catalysts has fueled speculation about whether the crypto market is facing an organized attempt to damage its credibility.

At this stage, there is no confirmed evidence of a coordinated campaign. However, the situation highlights how quickly sentiment can shift when misinformation spreads across social media and online communities.

For investors and observers, the key takeaway is the importance of verifying information and focusing on credible sources before drawing conclusions. The crypto market has experienced many periods of uncertainty, and sentiment driven by rumors can often amplify volatility.

LUNC Shows Strength as Crypto Market Drops Sharply

0

LUNC Shows Strength as Crypto Market Drops Sharply

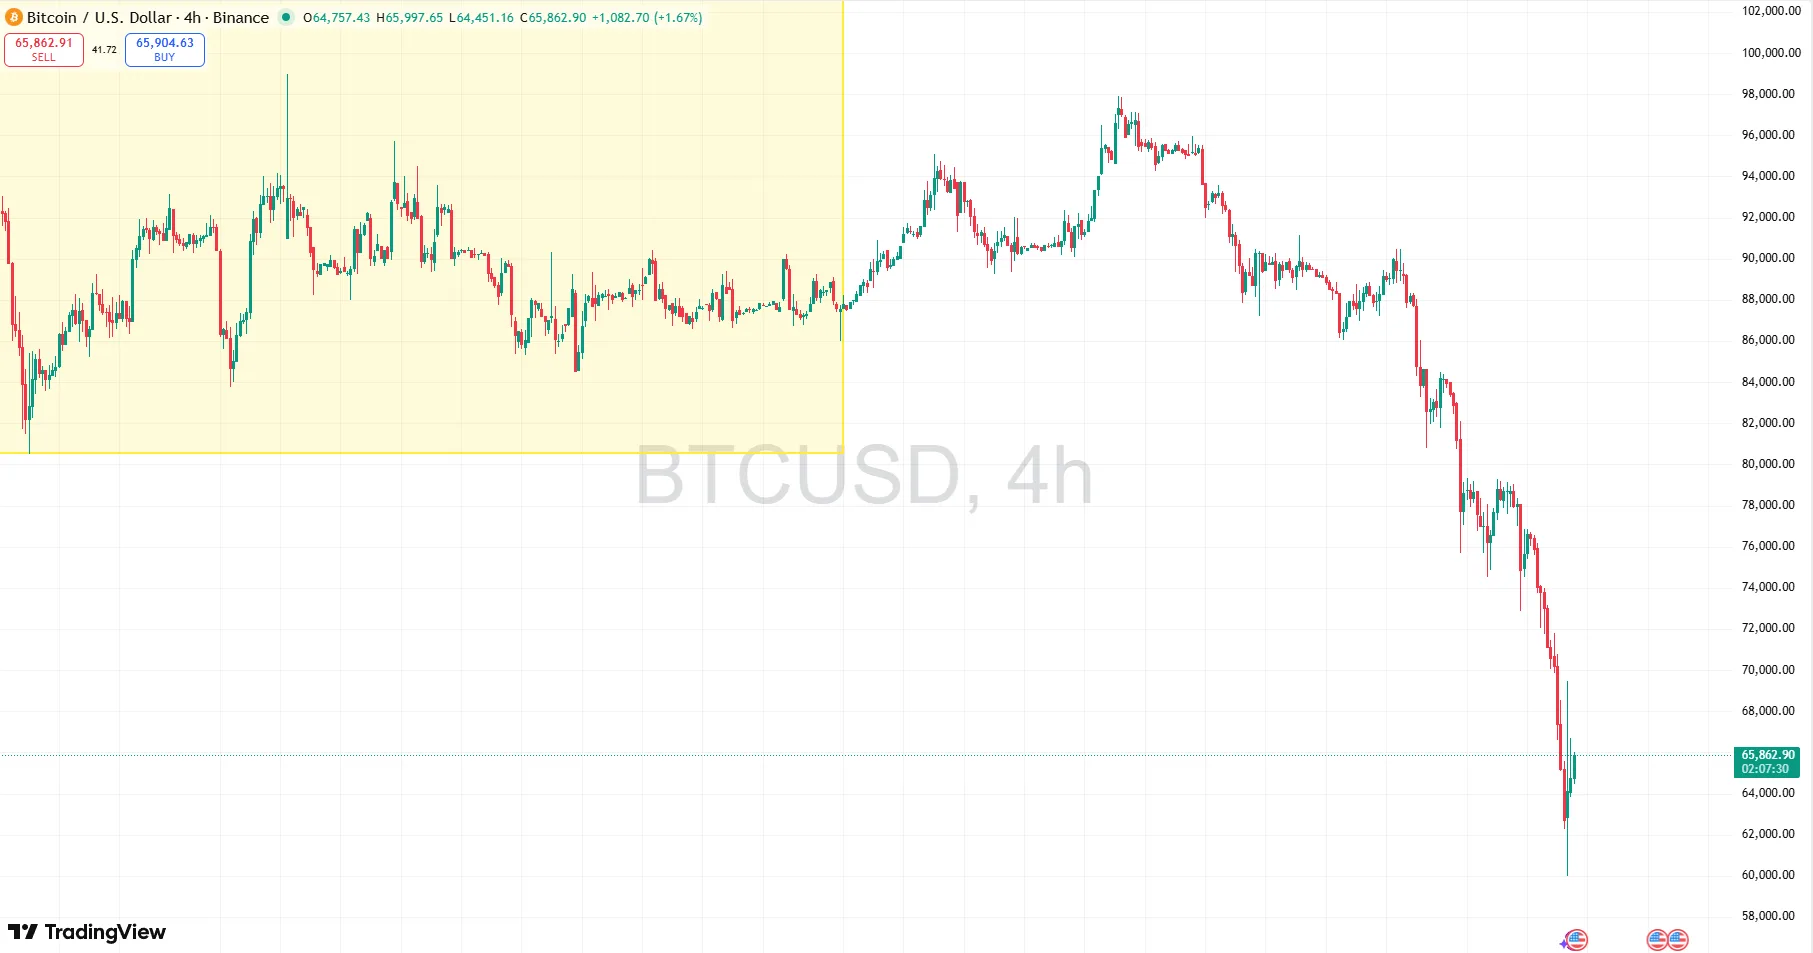
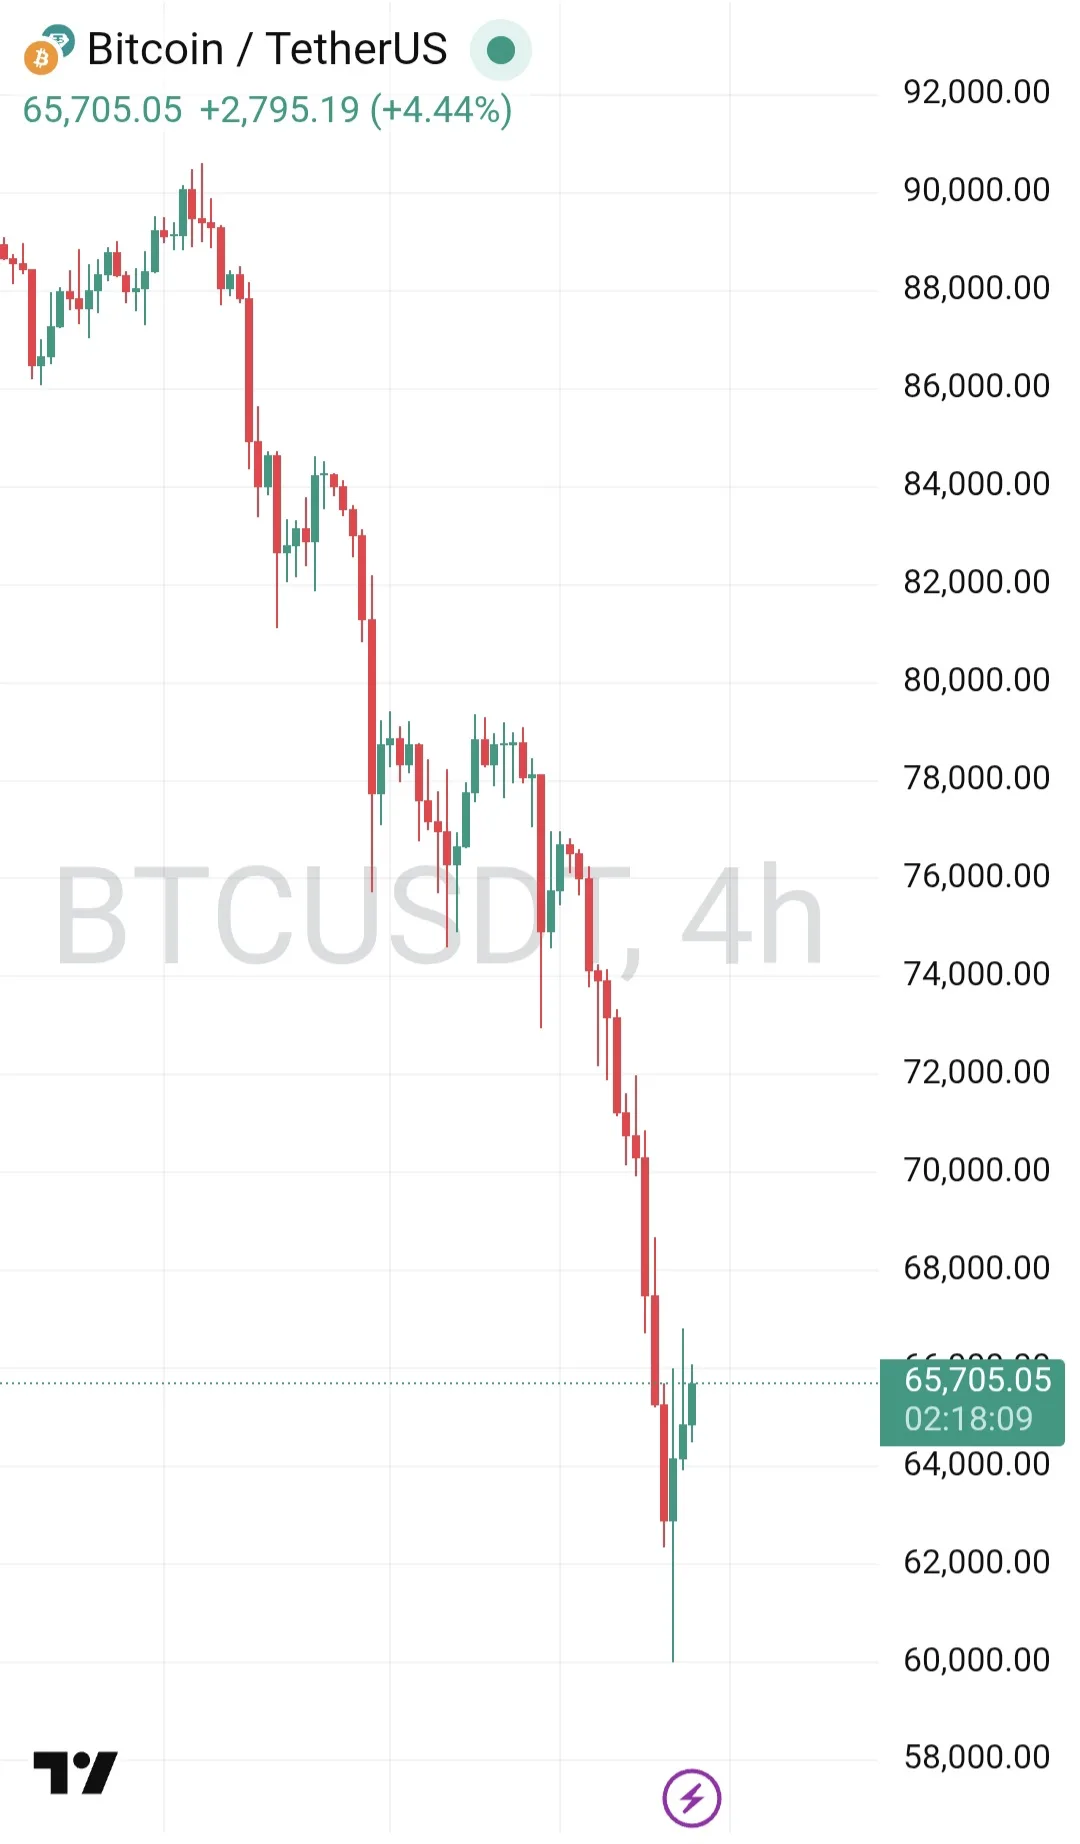
The cryptocurrency market experienced a major downturn yesterday, led by a sharp drop in Bitcoin. As Bitcoin fell toward the 60,000 level, the broader market followed, pushing most major cryptocurrencies into a strong downtrend.

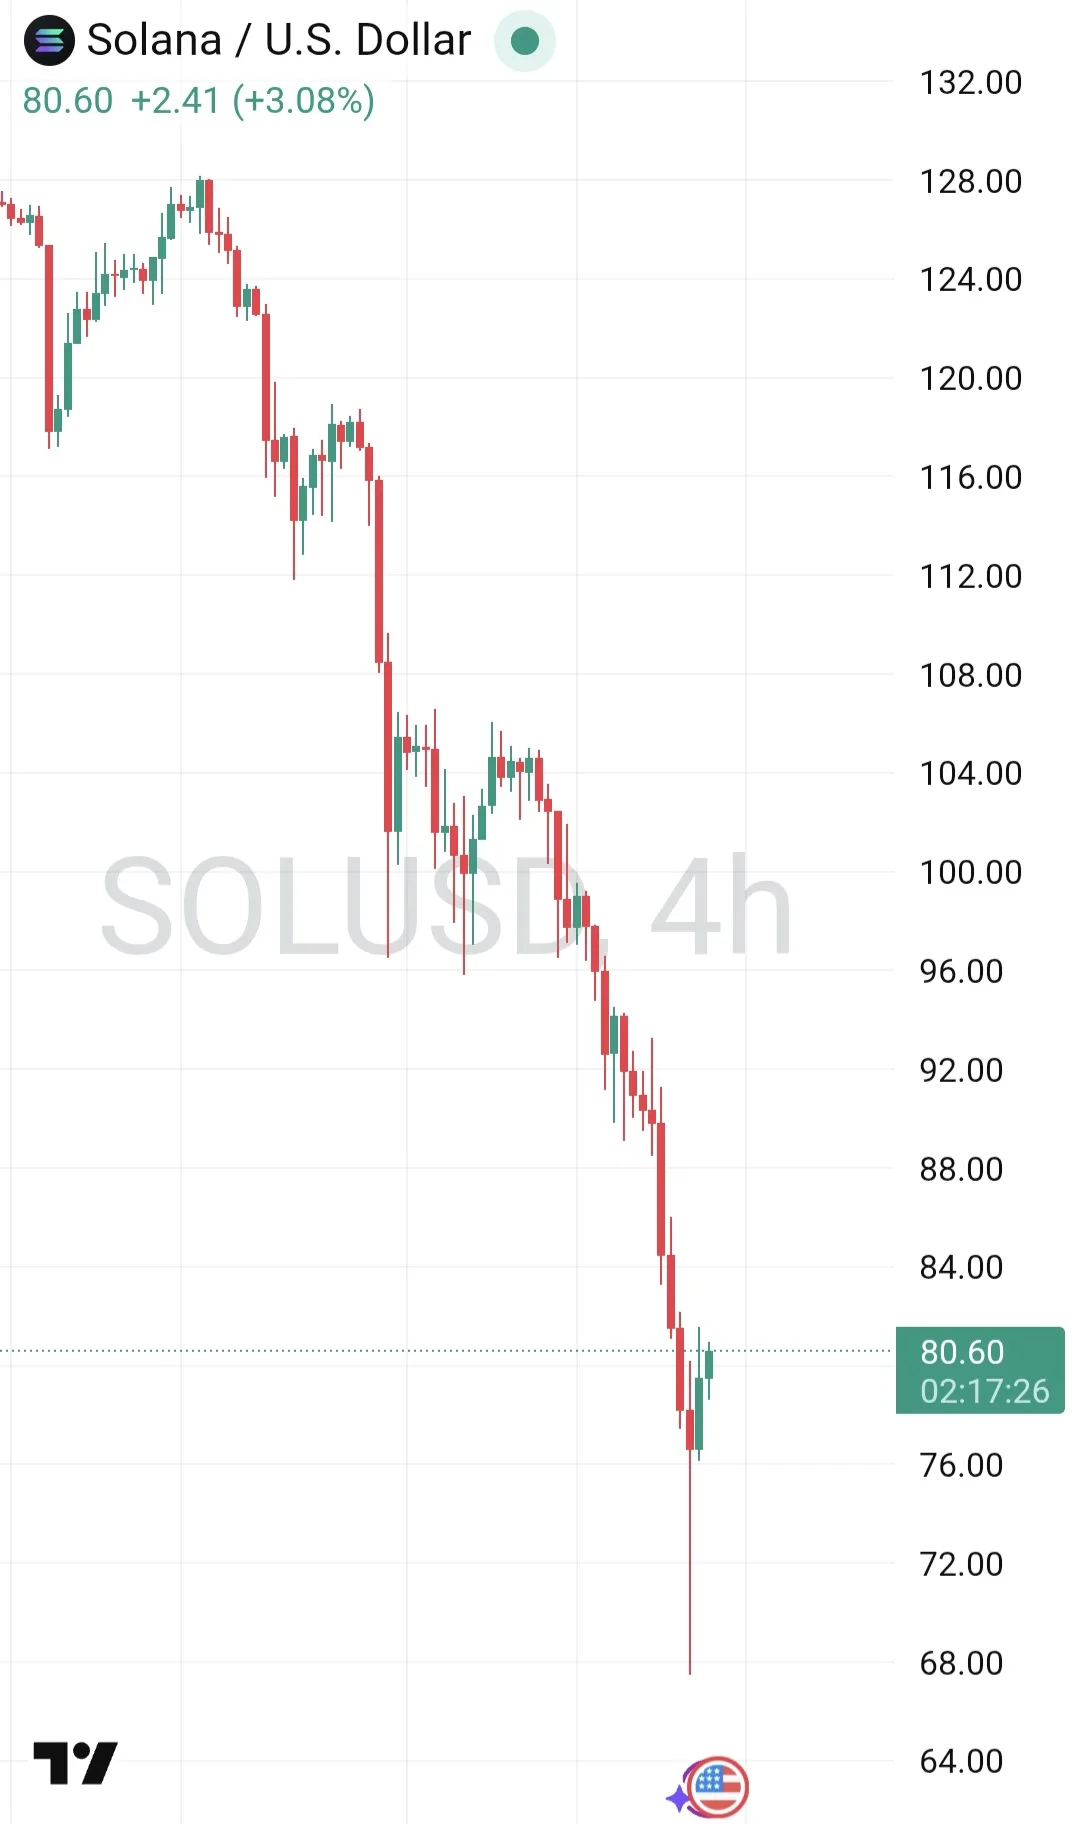
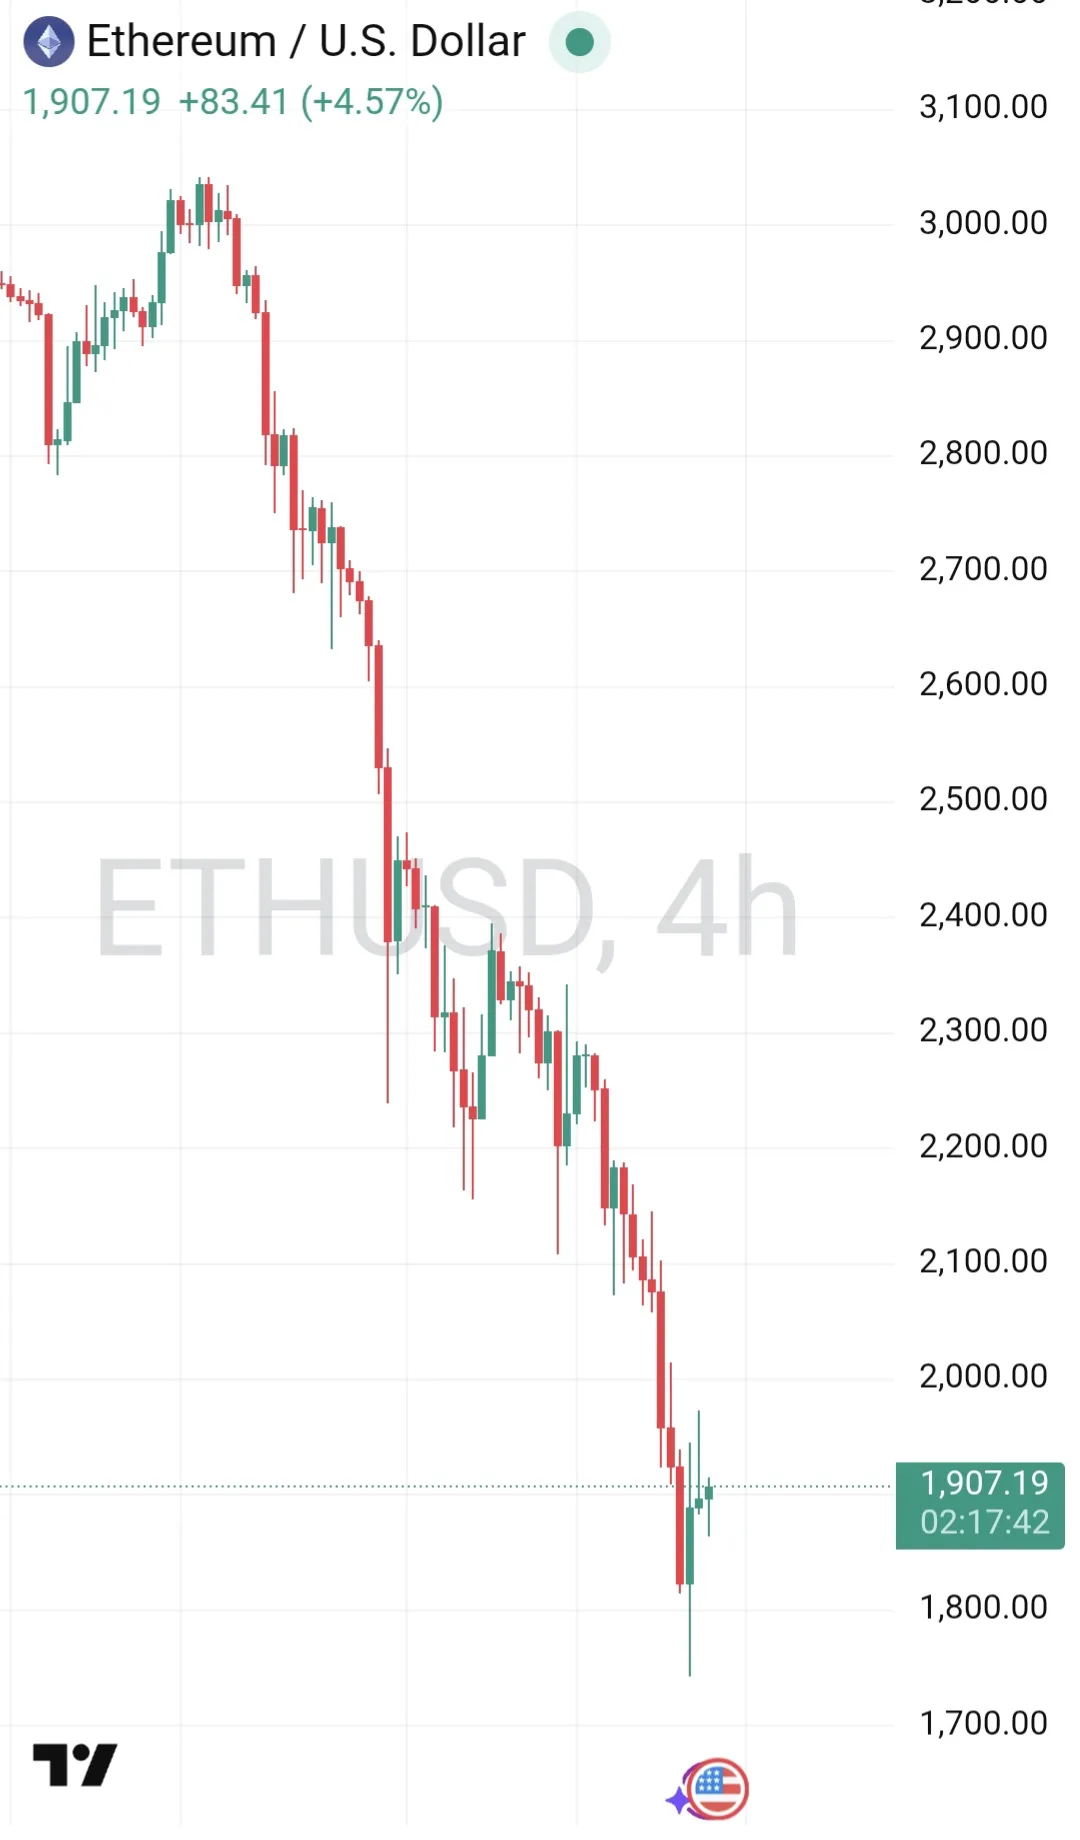
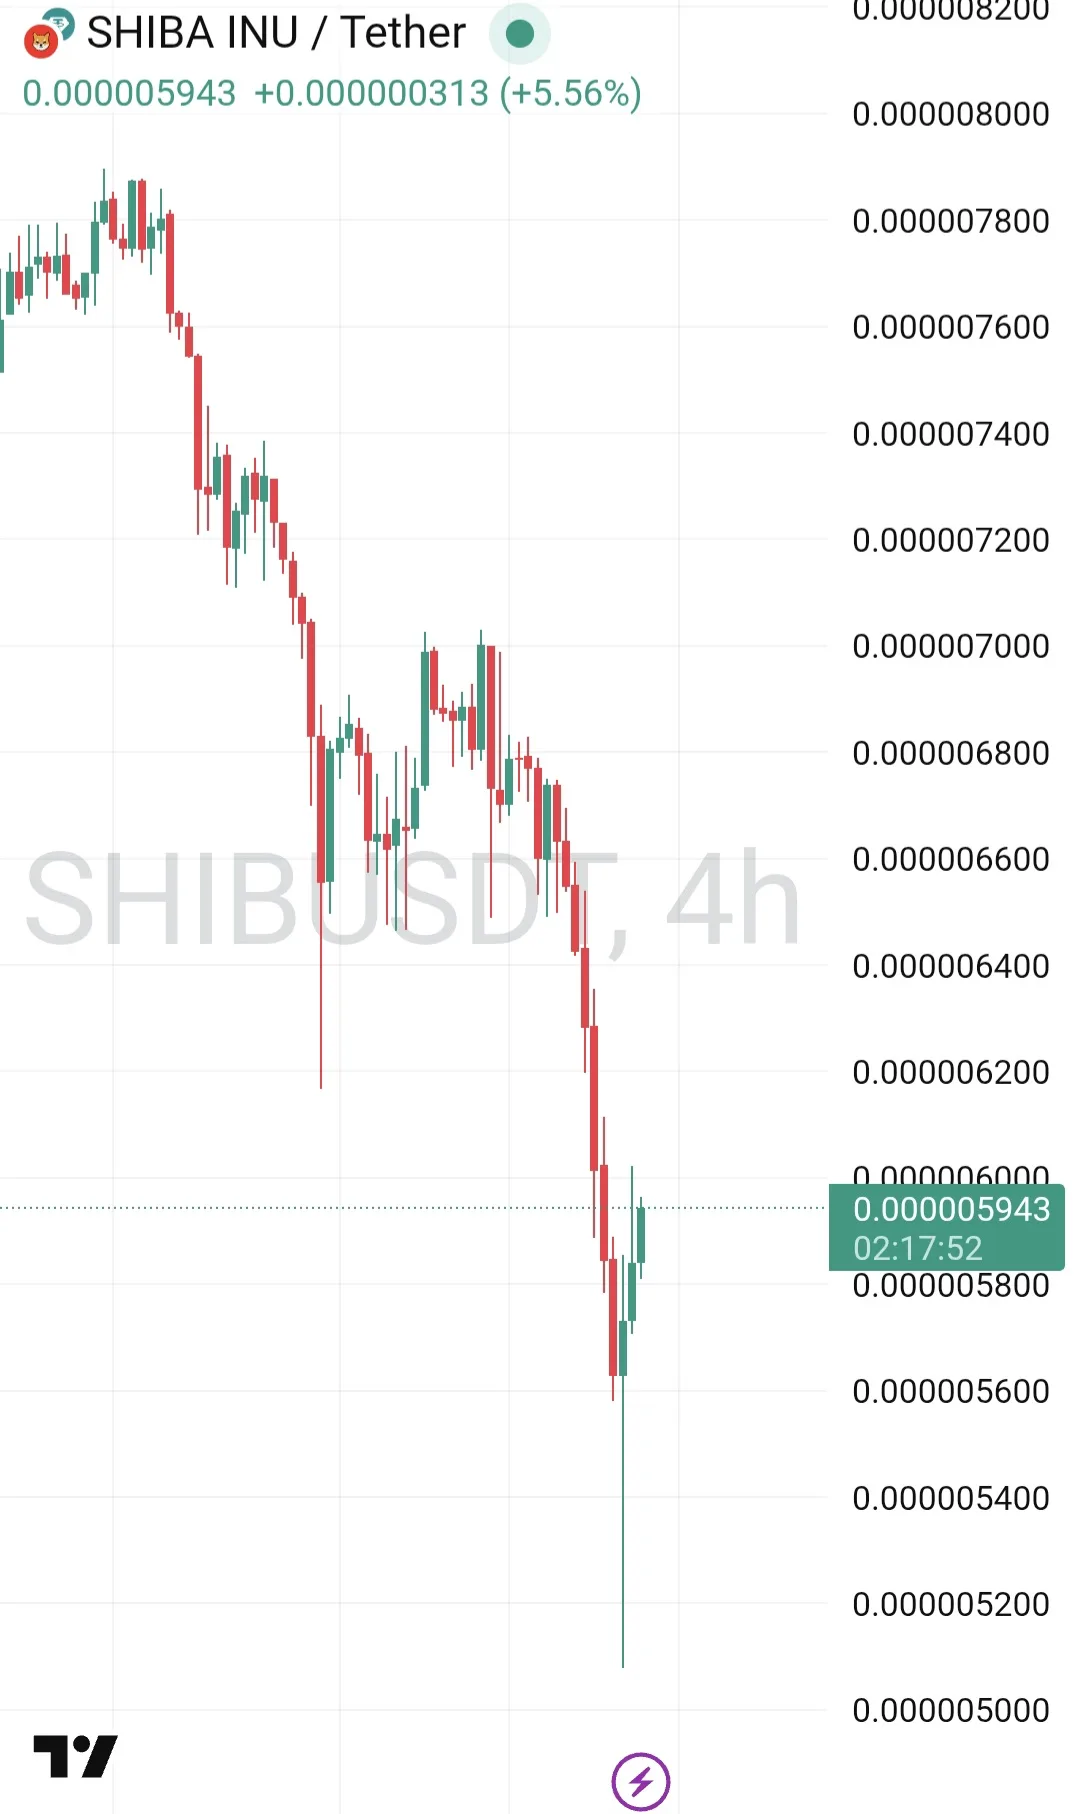
Many large assets reached their lowest levels in years. Ethereum, Solana, and even popular meme coins like Shiba Inu saw significant losses as selling pressure spread across the market.

However, Terra Classic stood out during this decline.

While most cryptocurrencies broke key support levels, LUNC managed to hold its long term support from 2025. The price decline remained relatively limited and stayed close to the support level recorded on January 31, 2026. This price behavior shows a clear difference compared to the broader market trend.

This relative strength is an important signal. When an asset holds support while the overall market falls, it often suggests strong community backing and reduced selling pressure.

Chart comparisons highlight how LUNC maintained its structure while other major cryptocurrencies broke down. This contrast has begun to attract attention from traders watching for early signs of recovery.


At the moment, LUNC is showing early indications of a potential reversal. While the wider market remains under pressure, Terra Classic is demonstrating resilience that could become significant if market conditions stabilize.

The coming days will be important as traders monitor whether this strength develops into a confirmed recovery.

Over 500,000 USTC Burned in Just 5 Days

0

Over 500,000 USTC Burned in Just Five Days as Community Activity Accelerates

The Terra Classic community has started February with a strong burn momentum. In just the first five days of the month, more than half a million USTC has already been permanently removed from circulation.

This early activity highlights continued community engagement and ongoing efforts to reduce supply. The largest burn occurred on February 4, which contributed the majority of the total burned so far.

Below is the daily USTC burn breakdown for the first five days of February.

Month Date USTC Burn
February 1 32,646
February 2 25,778
February 3 22,360
February 4 397,058
February 5 33,305
Total 511,147

The spike on February 4 stands out as the most significant burn day of the period. This surge pushed the five day total above 500,000 USTC, marking a strong start to the month.

While it is still early in February, the pace of burns is already attracting attention from the Terra Classic community. If this momentum continues, February could become another notable month for USTC supply reduction.

The community continues to monitor burn activity closely as efforts to improve the Terra Classic ecosystem move forward.

LUNC Price Analysis: Bearish Structure Persists as Bitcoin Trends Toward 70K

0

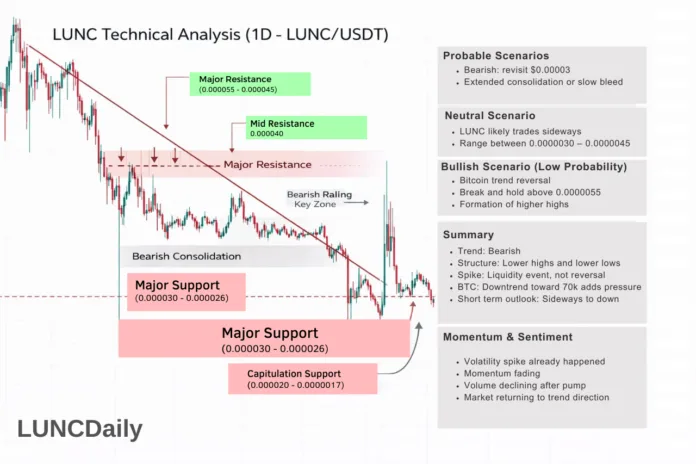
LUNC Technical Analysis (1D – LUNC/USDT)

Market Context

Before analyzing LUNC itself, we must start with Bitcoin.

Bitcoin’s daily structure is currently in a downtrend with price moving toward the 70,000 USD region. Historically, when Bitcoin trends down or shows weakness:

  • Liquidity leaves altcoins first
  • Altcoins underperform Bitcoin
  • Relief rallies on altcoins tend to be short lived

This macro pressure is clearly visible in the LUNC chart.

LUNC Market Structure

Primary Trend

LUNC remains in a clear long term downtrend.

  • Series of lower highs
  • Series of lower lows
  • Repeated rejection from resistance zones
  • No confirmed higher high on the daily timeframe

The large spike on the right side of the chart appears to be a news driven liquidity spike rather than a trend reversal. A single vertical pump does not change market structure.

Large Wick Event (Capitulation and Short Squeeze)

The chart shows two extreme candles:

  • A sharp liquidation wick downward
  • Immediately followed by a vertical pump

This typically signals massive liquidations and a short squeeze. After such events, markets usually enter consolidation or continue the main trend. Price quickly returned to sideways to downward movement, confirming this behavior.

Current Price Behavior

  • Price failed to hold the highs
  • Lower highs started forming again
  • The market moved into bearish consolidation

This shows buyers lack follow through. In simple terms, buyers reacted to news but are not strong enough to sustain a trend.

Key Levels

Major Resistance: 0.000045 – 0.000055

  • Previous support turned resistance
  • Post spike rejection zone
  • Sellers consistently appear here

LUNC must break and hold above this zone to start a bullish reversal discussion.

Mid Resistance: 0.000040

This is the current rejection area where price repeatedly fails, confirming weak momentum.

Major Support: 0.000030 – 0.000026

This is the most important level on the chart. If Bitcoin continues toward 70,000, this support becomes the primary downside target.

Capitulation Support: 0.000020 – 0.000017

This is the extreme liquidity zone from the long wick. If market risk increases, price often revisits these liquidity areas.

Momentum and Sentiment

  • Volatility spike already occurred
  • Momentum is fading
  • Volume declined after the pump
  • Market is returning to the main trend direction

This reflects classic bear market rally behavior.

Correlation with Bitcoin

Because Bitcoin is trending down toward 70,000, expected altcoin behavior includes:

  1. Lower liquidity
  2. Failed breakouts
  3. Range breakdown risk
  4. Gradual price decline

Upside moves may still occur short term, but they are likely temporary until Bitcoin stabilizes.

Probable Scenarios

Bearish Scenario (Higher Probability)

  • LUNC revisits 0.000030
  • Possible sweep of 0.000026 liquidity
  • Extended consolidation or gradual decline

Neutral Scenario

  • If Bitcoin stabilizes near 70,000
  • LUNC trades sideways between 0.000030 and 0.000045

Bullish Scenario (Low Probability)

  • Requires Bitcoin trend reversal
  • Break and hold above 0.000055
  • Formation of higher highs

Summary

  • Trend: Bearish
  • Structure: Lower highs and lower lows
  • Spike: Liquidity event, not reversal
  • Bitcoin trend adds pressure
  • Short term outlook: Sideways to down

Bitcoin Drops Toward 70K, Red Alert for LUNC

0

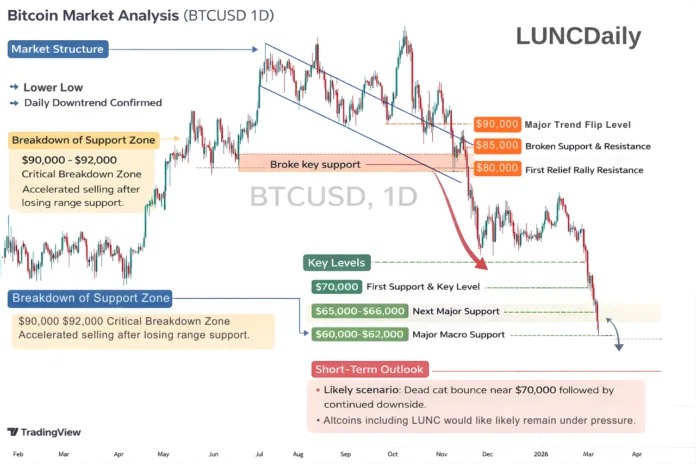
Bitcoin Market Analysis (BTCUSD 1D)

Market structure

Bitcoin has confirmed a major trend reversal on the daily timeframe.
After printing a cycle high near 124000 to 125000, price formed a lower high, a lower low, and then broke key support.
This confirms a daily downtrend structure.
The recent move is not a normal pullback. It is a capitulation leg.

What just happened on the chart

The most important event is the loss of the 90000 to 92000 support zone.
This level previously acted as range support in December and a bounce zone multiple times.
Once this level broke, sellers accelerated and we saw a vertical liquidation drop toward 70000.
This type of move usually indicates long liquidations, panic selling, and a shift from bullish to bearish momentum.

Current momentum

Recent candles show large bearish bodies and little bullish follow through.
Price is closing near daily lows, which means sellers still control the market.
There is no confirmed bottom yet.

Key support levels

  • 70000 zone. First reaction support and high volatility area.
  • 65000 to 66000. Previous consolidation zone and strong demand area.
  • 60000 to 62000. Major macro support and full correction territory.

Key resistance levels

  • 80000. First relief rally resistance.
  • 85000. Broken structure resistance.
  • 90000. Major trend flip level.

Only a reclaim above 90000 would weaken the bearish outlook.

Short term outlook

The most likely scenario is a temporary bounce near 70000 followed by continued volatility and retests.
The market is shifting from euphoria to fear.
This does not end the bull cycle, but it confirms a mid cycle correction.


LUNC Analysis

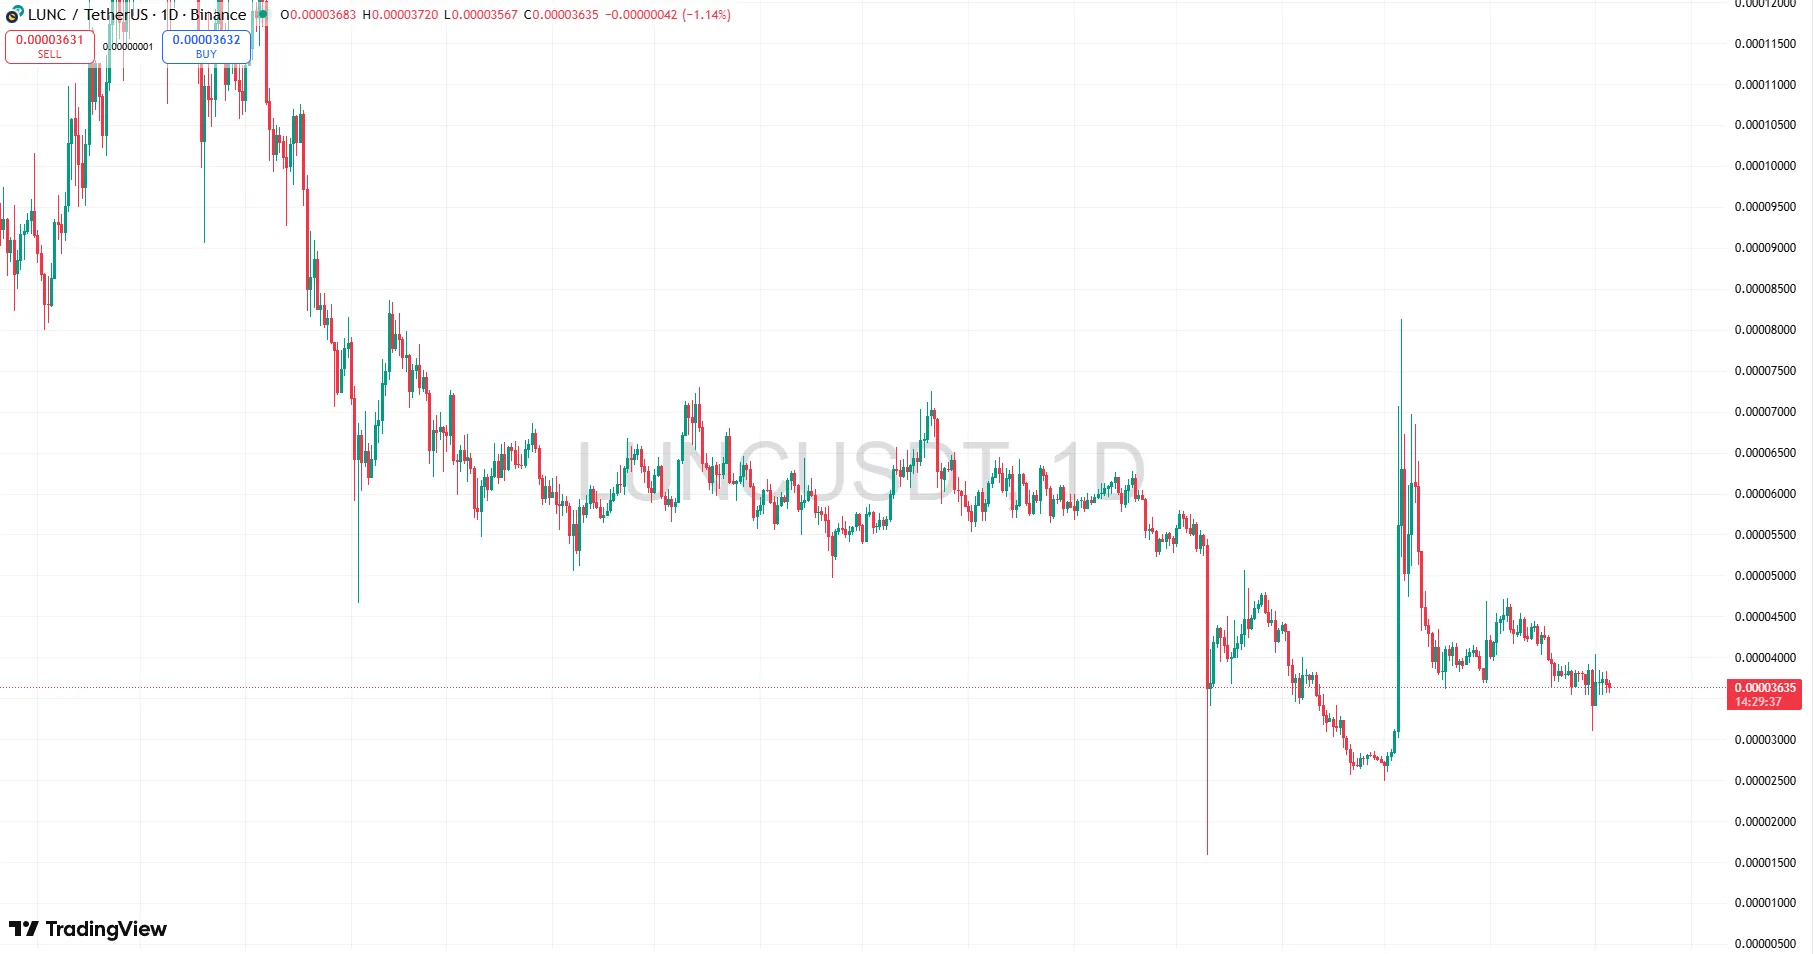
Current price: 0.000036 USD

Market context

When Bitcoin enters a strong correction, altcoins usually drop faster, recover slower, and lose liquidity.
LUNC historically has high correlation with Bitcoin, which means it moves more aggressively during market stress.

LUNC market structure

LUNC is currently in a macro downtrend continuation phase.
Bitcoin weakness removes retail momentum and speculative liquidity, which directly impacts LUNC.

Key support levels

  • 0.000034 to 0.000032. Immediate support zone and possible bounce area.
  • 0.000028. Strong historical support if Bitcoin drops toward 65000.
  • 0.000022 to 0.000025. Panic zone if Bitcoin approaches 60000.

Resistance levels

  • 0.000042. First trend resistance.
  • 0.000048. Structure reclaim level.
  • 0.000055. Momentum return zone.

Outlook

Short term, expect volatility and downside pressure with possible relief bounces.
Medium term recovery for LUNC will likely begin only after Bitcoin finds a stable bottom.


Summary

  • Bitcoin has entered a confirmed daily downtrend.
  • 70000 is the first major support but the bottom is not confirmed.
  • Altcoins including LUNC will likely remain under pressure.
  • LUNC may test lower supports if Bitcoin continues correcting.
  • This is a correction phase, not the end of the crypto cycle.

Over 1.5 Billion LUNC Burned in Just Four Days as February Opens Strong

0

Over 1.5 Billion LUNC Burned in Just Four Days as February Opens Strong

February has started with strong burn activity for Terra Classic. In just the first four days of the month, more than 1.5 billion LUNC has been permanently removed from circulation. This early momentum highlights the ongoing commitment to reducing supply and supporting the long term ecosystem recovery.

Binance Leads the Largest Burn of the Month

The largest burn occurred on February 1, driven primarily by Binance as part of its monthly LUNC burn program. On that day alone, Binance burned 1,082,000,899 LUNC, making it the most significant single contribution during this period.

This monthly burn initiative continues to play a major role in the Terra Classic burn strategy and remains one of the largest consistent sources of supply reduction.

Daily LUNC Burn Breakdown

Below is the daily burn activity recorded during the first four days of February.

Month Date LUNC Burn
February 1 1,147,191,675
February 2 168,648,532
February 3 55,419,874
February 4 138,464,391
Total 1,509,724,472

A Strong Start to February

With more than 1.5 billion LUNC burned in only four days, February has opened with strong momentum. The continued participation from major contributors and the broader community reflects ongoing support for supply reduction and long term ecosystem stabilization.

As the month continues, the community will be watching closely to see how burn activity develops and how it contributes to Terra Classic’s broader recovery efforts.