
Home Blog Page 19

This Proposal to Rebalance Transaction Tax Aims to Strengthen On Chain Income and Long Term Sustainability for Luna CLassic – Tax Split Rework Proposal

0

Terra Classic Proposal to Rebalance Transaction Tax Aims to Strengthen On Chain Income and Long Term Sustainability

Terra Classic Transaction Tax Split Rework Explained

A new governance proposal suggests changing how the current 0.5 percent transaction tax on Terra Classic is distributed. The goal is to improve long term sustainability, strengthen network security, and increase on chain income that supports ecosystem growth.

The proposal does not change the total tax rate. Instead, it focuses on redistributing how the tax is allocated.

Current Transaction Tax Distribution

Today, every on chain transaction is taxed at 0.5 percent and divided as follows:

  • 0.40 percent is burned
  • 0.05 percent goes to the Oracle Pool
  • 0.05 percent goes to the Community Pool

This means that 80 percent of the network income is permanently removed from circulation through burning.
While burning reduces supply, excessive burning can remove capital from the ecosystem without guaranteeing price growth if demand does not increase at the same pace.

Why Change Is Being Proposed

The current tax split creates several long term challenges:

  • Removes liquidity from the market
  • Reduces available funding for development and ecosystem growth
  • Discourages large transactions due to higher friction
  • Lowers staking rewards and weakens network security

As a Proof of Stake blockchain, Terra Classic depends heavily on strong validator participation and reliable oracle rewards. Without sufficient funding, long term decentralization and security could be at risk.

Proposed New Tax Split

The total transaction tax remains 0.5 percent and would be redistributed as follows:

  • 0.10 percent Burn
  • 0.20 percent Community Pool
  • 0.20 percent Oracle Pool

Burning remains part of the system, but more funds are redirected toward strengthening the ecosystem.

How the New Allocations Would Be Used

Burn Allocation 0.10 Percent

  • Maintains ongoing supply reduction
  • Keeps deflation tied to real network activity

Community Pool Allocation 0.20 Percent

The Community Pool would support ecosystem growth and market stability:

  • Decentralized exchange liquidity
  • Market support and stability initiatives
  • Infrastructure development, upgrades, and audits
  • Marketing and legal support
  • Collateral growth and ecosystem programs

All spending would remain transparent and require governance approval.

Oracle Pool Allocation 0.20 Percent

  • Stabilizing oracle rewards
  • Encouraging validator participation
  • Maintaining reliable price feeds
  • Reducing reliance on shrinking reserves

Core Idea Behind the Proposal

  • Maintain controlled deflation
  • Improve liquidity and trading conditions
  • Strengthen staking rewards and security
  • Fund development and long term growth

Why This Proposal Matters

Income flowing into the Community Pool and Oracle Pool continues to decrease because a large portion of transaction tax revenue is burned instead of being redirected to ecosystem funding.
By increasing the tax share allocated to these pools, the proposal aims to increase on chain income and provide sustainable funding for security, development, and ecosystem expansion.

Final Goal

  • Maintain controlled burning
  • Support liquidity and market growth
  • Prevent oracle reward depletion
  • Reduce the risk of needing inflation in the future

The proposal represents a shift toward balancing deflation with sustainable funding to support the future growth of Terra Classic.
LUNC Price Begins Short Term Uptrend as Buyers Regain Control

0

LUNC USDT 4H Technical Analysis

Market context

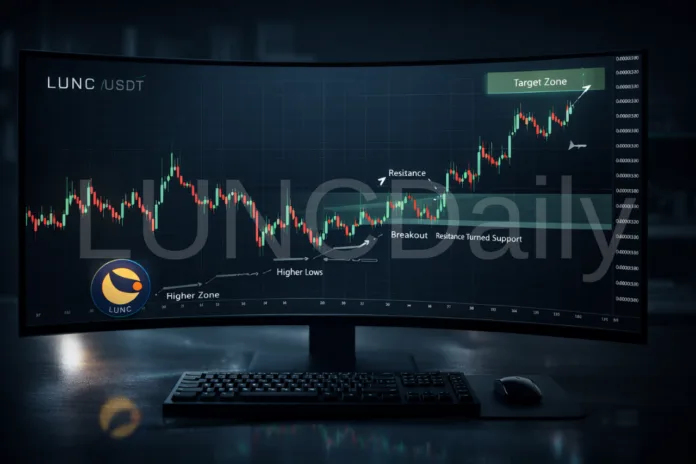
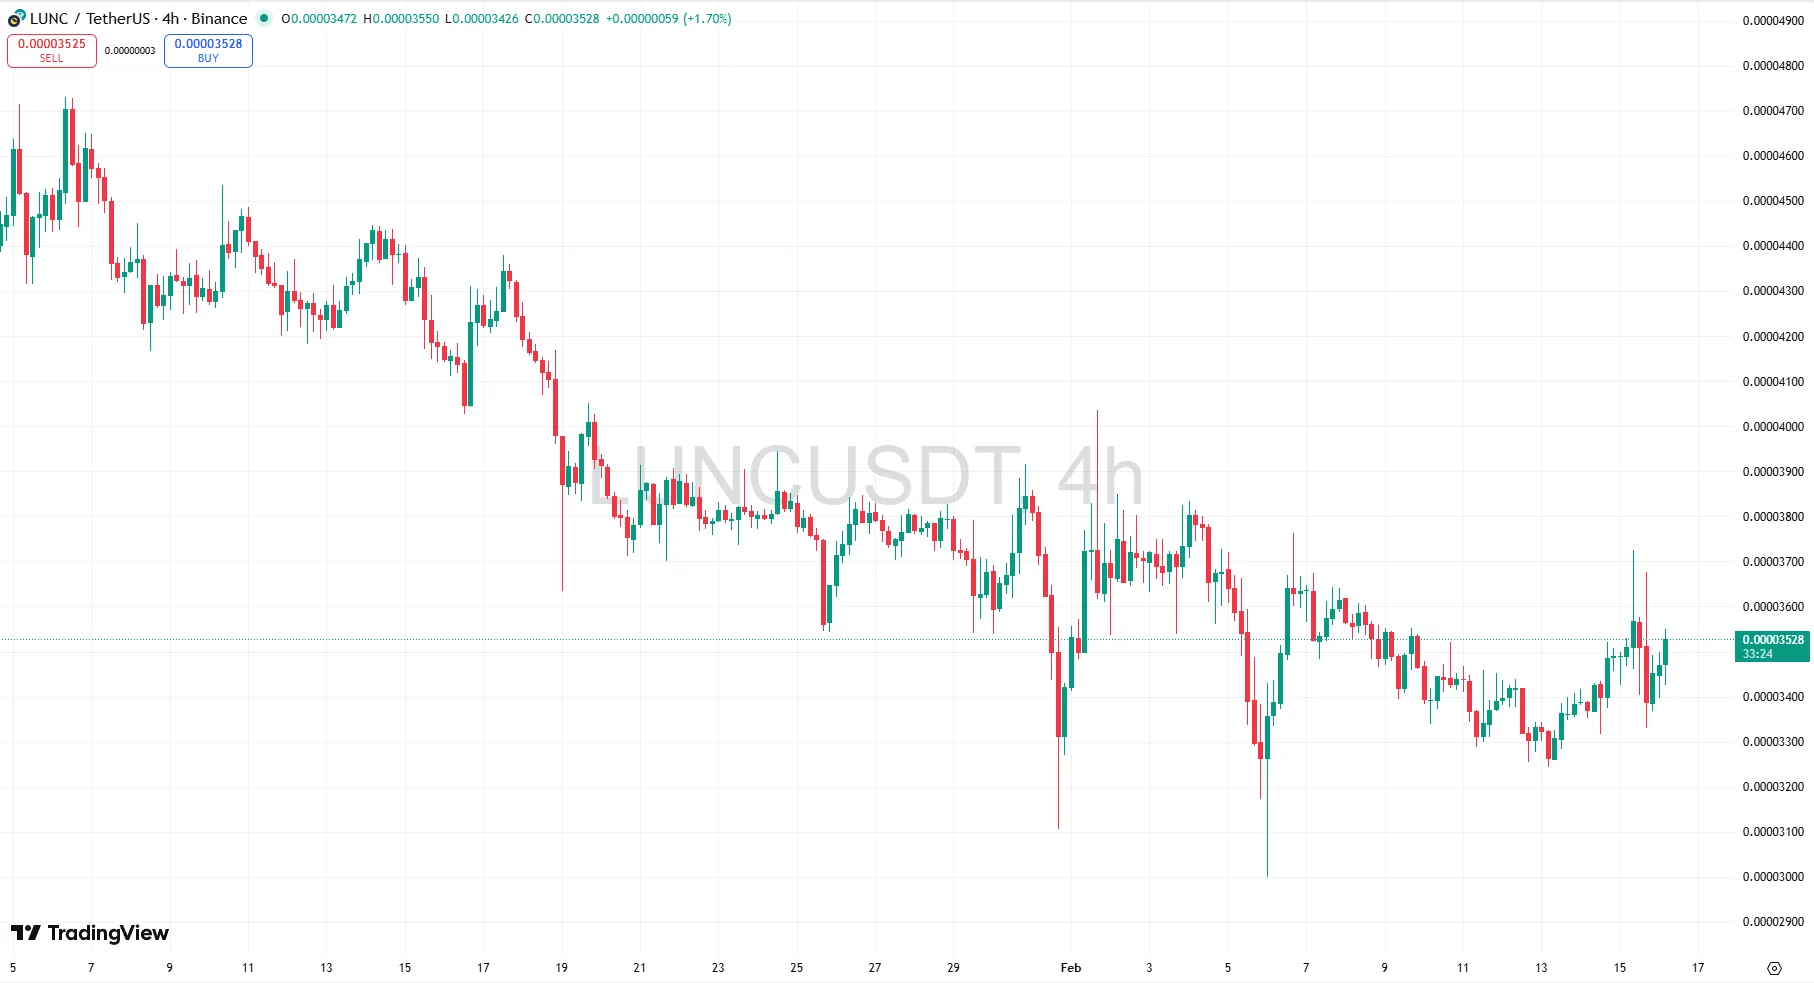
After a prolonged downtrend and a long period of sideways movement, the chart is now showing a clear shift in short term direction. The most recent candles show buyers stepping in and pushing price upward.

Today’s price action

On the right side of the chart, price has started moving up from the recent local bottom near the 0.000033 area.

  • A higher low
  • A breakout above short term resistance near 0.000035
  • Continuation candles holding above that level

This confirms the start of a short term uptrend on the 4H timeframe.

Momentum shift

Before today, price was drifting sideways with weak movement and no direction. Today, the behavior changed.

  • Buyers are stepping in quickly on dips
  • Pullbacks are shallow
  • Price is moving upward in waves

This is the first sign of real bullish momentum returning.

Resistance turning into support

The zone around 0.000035 acted as resistance multiple times earlier on the chart. Today price broke above it and is now holding above it.

When resistance becomes support, it usually signals continuation to the upside. This is one of the strongest early bullish signals on the chart.

Higher lows structure

The most important change is the formation of higher lows. Price is no longer making new lows. Instead, each pullback is stopping higher than the previous one.

Higher lows are the foundation of every uptrend.

Key resistance ahead

The next major resistance zone sits around 0.0000365 to 0.000038. This area previously rejected price multiple times.

Price is now approaching this level with rising momentum. If this zone breaks, the market exits the short term range and confirms a stronger bullish continuation.

Bullish scenario

If buyers continue defending dips and price breaks above 0.000038, the move can accelerate quickly due to breakout momentum and trapped sellers re entering the market.

Final conclusion

LUNC has started moving up on the 4H timeframe. Today’s price action confirms the beginning of a short term bullish trend. Momentum is shifting to buyers, resistance has turned into support, and the market is pushing toward the next breakout level.

The chart now shows early signs of a new upward move beginning.

Over 2.13 billion LUNC have been burned in the last 15 days

0

Terra Classic Burn Surpasses 2.1 Billion LUNC in the First Half of February

The Terra Classic ecosystem continues to show strong commitment to supply reduction. During the first 15 days of February, the community successfully burned more than 2.13 billion LUNC, marking a significant milestone in the ongoing effort to reduce circulating supply and support long term ecosystem recovery.

The largest contribution occurred on February 1, when Binance executed its monthly LUNC burn and removed approximately 1.08 billion LUNC from circulation. This single event accounted for more than half of the total burn during the period, highlighting the continued impact of the exchange’s burn program.

Why the February Burns Matter

Token burns remain one of the most closely watched metrics within the Terra Classic community. Consistent and transparent burns demonstrate ongoing ecosystem activity, exchange participation, and long term commitment to reducing supply pressure.

The strong start to February shows that burn momentum remains steady, supported by both centralized exchange initiatives and daily community driven contributions.

Daily LUNC Burn Breakdown

Month Date LUNC Burn
February 1 1,147,191,675
February 2 168,648,532
February 3 55,419,874
February 4 138,464,391
February 5 36,216,303
February 6 48,908,522
February 7 20,794,946
February 8 32,404,845
February 9 30,669,205
February 10 33,716,529
February 11 52,436,522
February 12 30,121,985
February 13 101,813,794
February 14 17,099,526
February 15 220,095,107
Total 2,134,001,756

Strong Momentum Continues

With more than two billion LUNC burned in just half a month, February is shaping up to be another notable period for Terra Classic supply reduction. The combination of exchange participation and daily community burns continues to play an important role in the ecosystem’s long term recovery strategy.

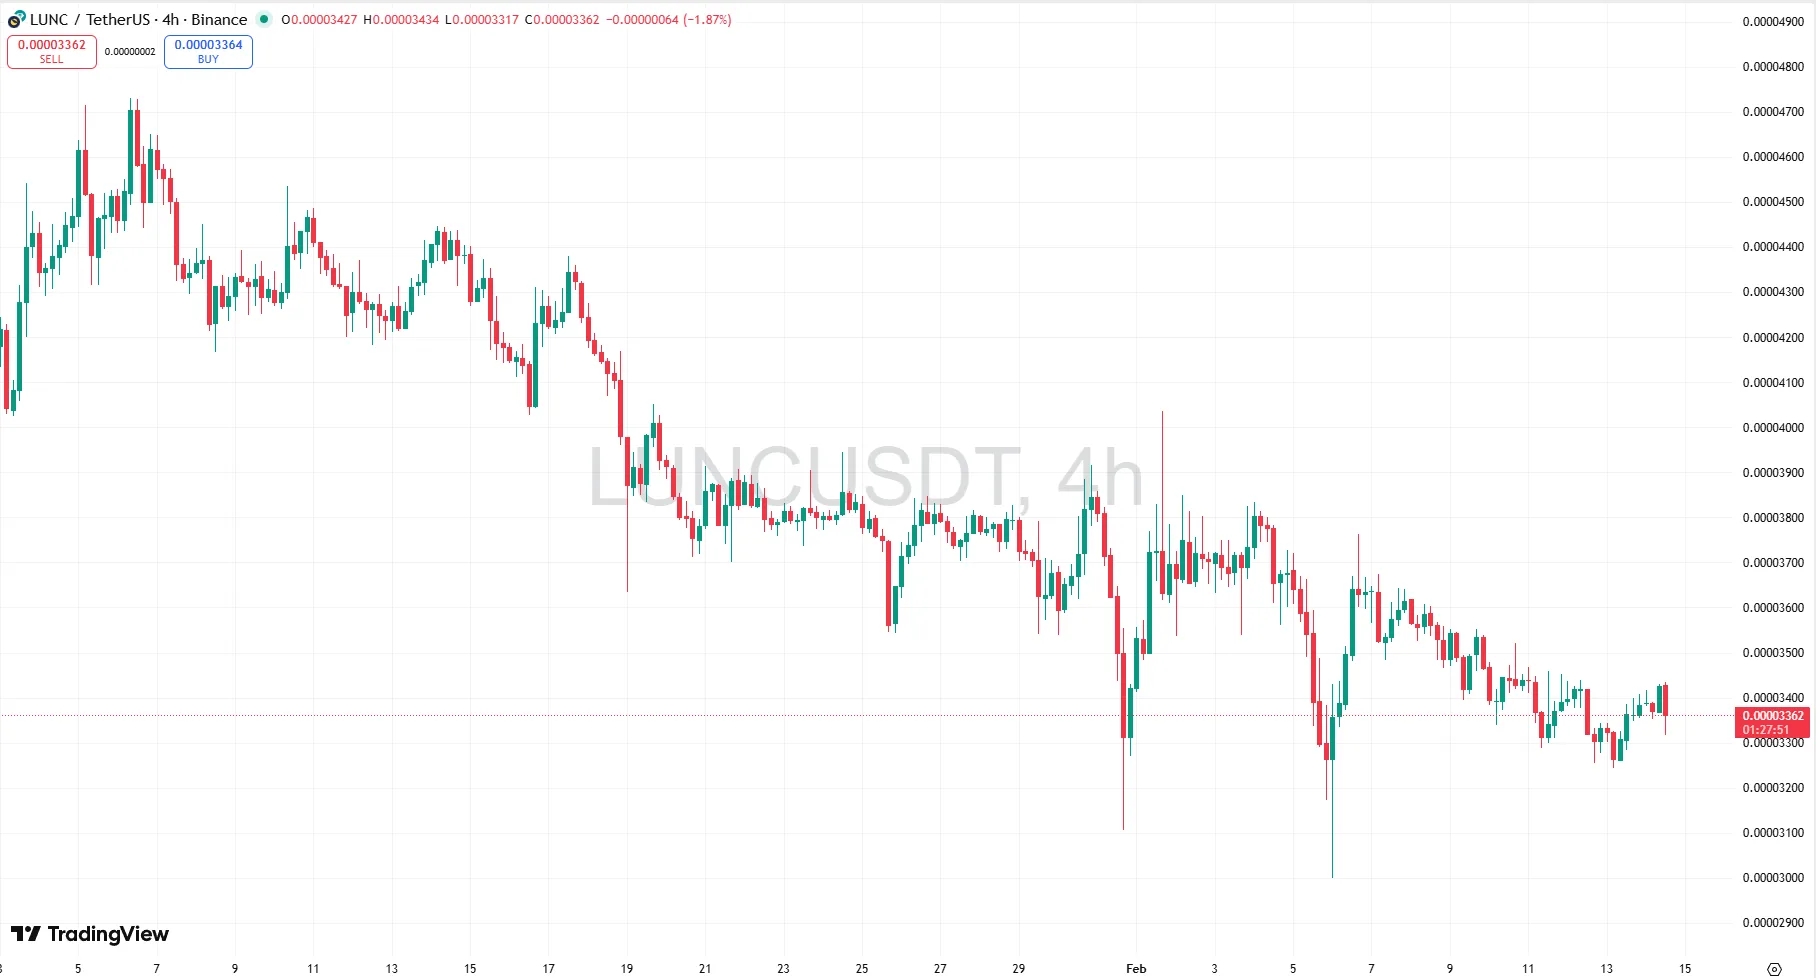
Terra Classic Price Analysis Signals Early Accumulation Phase on the 4 Hour Chart

0

Terra Classic Price Analysis Signals Early Accumulation Phase on the 4 Hour Chart

Terra Classic is showing early signs of a market transition after a prolonged downtrend. The latest four hour chart reveals a shift from aggressive selling toward price stabilization and accumulation. This stage is often the foundation for a potential recovery phase, especially when strong support repeatedly holds.

This article explains the current chart structure in simple terms so beginners can understand what the market is signaling.

Market Structure Is Shifting From Downtrend to Consolidation

The previous trend was clearly bearish, with consistent lower highs and lower lows. However, the most recent price action tells a different story. Instead of continuing to fall sharply, price has begun moving sideways within a tightening range.

This transition from trending movement to sideways compression is a critical development. Markets typically move through a cycle that includes trend, consolidation, and then reversal or continuation. The current phase suggests the downtrend is losing strength.

One of the earliest signs of this change is that price is no longer making strong new lows. Instead, movements are becoming smaller and more controlled.

Strong Support Zone Is Clearly Established

A major demand area has formed between 0.00003300 and 0.00003330. This zone has been tested multiple times, and each test shows strong buying activity.

Key signs of support strength include:

  • Sharp downside wicks into the same price area
  • Quick recoveries after selloffs
  • Repeated returns above support

Long lower wicks are especially important. They indicate that sellers pushed the price down but buyers stepped in aggressively and pushed the price back up. When this happens repeatedly at the same level, it often signals accumulation by larger market participants.

Evidence of Seller Exhaustion Appears

One of the most important candles on the chart is a large bearish move that created a deep wick and immediately reversed. This type of price action is often called a liquidity sweep.

A liquidity sweep occurs when stop losses are triggered below support, followed by strong buying that quickly reverses the move. After this event, several changes became visible:

  • Downward moves became weaker
  • Bounces became faster
  • Overall volatility began to compress

These changes suggest that selling pressure is fading and the market is stabilizing.

Early Signs of Higher Low Formation

Although the market still appears sideways, the internal structure is improving.

  • Large selloffs are no longer creating meaningful new lows
  • Small higher lows are beginning to form
  • Price is holding above the key support zone

This represents the earliest stage of a potential trend reversal. Reversals rarely happen instantly. Instead, they begin with stabilization and gradual improvement in market structure.

Volatility Compression Signals Potential Breakout

Price is now trading inside a tightening range:

  • Support near 0.00003300
  • Resistance between 0.00003650 and 0.00003800

When volatility decreases after a downtrend, it often means the market is building energy for a larger move. This phase is commonly known as compression.

Compression does not guarantee direction, but when it appears after seller exhaustion and strong support, the probability of a bullish breakout increases.

Bullish Scenario to Watch

If the support zone continues to hold, the next important signal would be a breakout above resistance.

Key confirmation levels include:

  • A strong candle closing above 0.00003650
  • Continued movement above 0.00003800

A confirmed breakout could trigger a short term recovery as buyers re enter the market and momentum begins to shift.

Beginner Friendly Summary

The Terra Classic market is no longer strongly bearish. Selling pressure is weakening. Buyers are defending a clear support zone. Price is compressing within a tight range. This combination of signals suggests the market is entering an early accumulation phase, which often appears before a bullish reversal begins.

Over 850,000 USTC Burned in the Last 14 Days as Community Efforts Continue

0

Over 850,000 USTC Burned in the Last 14 Days as Community Efforts Continue

The Terra Classic community continues to push forward with its supply reduction strategy. Over the past 14 days, more than 850,000 USTC has been permanently removed from circulation through ongoing burn initiatives.

These consistent burns highlight continued participation and long term commitment from the community toward reducing supply and supporting ecosystem recovery.

As of February 14, a total of 855,073 USTC has already been burned. It is important to note that the burn total for February 14 is still increasing and the final number for the day has not yet been reached.

Daily USTC Burn Breakdown

Below is the full daily burn recap for the last 14 days.

Month Date USTC Burn
February132,646
February225,778
February322,360
February4397,058
February538,305
February637,655
February7143,878
February86,247
February923,966
February103,444
February1114,996
February1213,285
February139,757
February14*85,698

*February 14 burn is still in progress.

Total Burned: 855,073 USTC

Key Highlights From the Burn Activity

The burn activity shows several notable spikes. The largest burn day occurred on February 4, when more than 397,000 USTC was removed from circulation in a single day. Another strong burn day followed on February 7 with over 143,000 USTC burned.

These larger burn events played a major role in pushing the two week total past the 850,000 mark.

What This Means for the Ecosystem

Ongoing burn activity remains one of the core strategies aimed at reducing excess supply and rebuilding long term confidence in the Terra Classic ecosystem. While daily burn numbers vary, the steady overall trend demonstrates consistent participation and momentum.

With February 14 still in progress, the total burn figure is expected to continue rising, further strengthening the supply reduction effort.

The community continues to monitor burn progress closely as part of the broader recovery roadmap.

Over 1.9 Billion LUNC Burned in the Last 14 Days as Supply Reduction Accelerates

0

Over 1.9 Billion LUNC Burned in the Last 14 Days as Supply Reduction Accelerates

The Terra Classic ecosystem continues to push forward with its long term supply reduction strategy. In the first half of February, more than 1.9 billion LUNC has already been permanently removed from circulation, highlighting consistent burn activity across the network.

Token burning remains one of the most important mechanisms for the Terra Classic community. By permanently removing tokens from the supply, the burn effort aims to support long term scarcity and strengthen the economic foundation of the ecosystem.

In just fourteen days, the burn total has reached 1,903,969,066 LUNC, and the number continues to grow as the final day of the period is still in progress.

Daily LUNC Burn Breakdown

Below is the full daily burn recap for February so far.

Month Date LUNC Burn
February 1 1,147,191,675
February 2 168,648,532
February 3 55,419,874
February 4 138,464,391
February 5 36,216,303
February 6 48,908,522
February 7 20,794,946
February 8 32,404,845
February 9 30,669,205
February 10 33,716,529
February 11 52,436,522
February 12 30,121,985
February 13 101,813,794
February 14 7,161,943*

*February 14 data is still in progress.

Total Burned: 1,903,969,066 LUNC

February 1 Led the Burn Surge

The largest burn day during this period occurred on February 1, when more than 1.14 billion LUNC was removed from circulation in a single day.

Binance contributed the majority of this burn, removing approximately 1.08 billion LUNC, which accounted for most of the day’s total. This highlights the continued impact of exchange driven burn contributions within the Terra Classic ecosystem.

Following the initial surge, daily burns stabilized into a consistent pattern ranging between tens of millions and over one hundred million tokens per day. This steady activity demonstrates ongoing commitment from contributors, validators, and ecosystem participants.

Why Continuous Burning Matters

Token burning plays a crucial role in Terra Classic’s long term recovery strategy. The primary goals include:

Reducing circulating supply
A lower supply creates stronger scarcity over time, which can help support long term value growth if demand increases.

Strengthening community confidence
Consistent burns signal active ecosystem participation and long term commitment.

Building long term sustainability
A steady burn rate shows that the supply reduction plan is not dependent on single events but continues through ongoing activity.

Momentum Continues

With the last day of the period still incomplete, the total burn number is expected to rise further. If the current pace continues, February could become another strong month for Terra Classic supply reduction.

The latest burn data reinforces a clear message: the community driven effort to reduce supply remains active and consistent, with billions of LUNC continuing to be removed from circulation.

Is Terra Classic Forming a Bullish Base?

0

Is Terra Classic Forming a Bullish Base? 4 Hour Chart Signals Early Accumulation

Introduction

Terra Classic is beginning to show early signs of stabilization after a prolonged downtrend. The latest 4 hour chart structure suggests that selling pressure is weakening while buyers are quietly stepping back into the market.

This article explains the current price structure in a clear and beginner friendly way and explores why the market may be entering an early accumulation phase.

Market Overview

For several weeks, Terra Classic has been in a clear downtrend defined by lower highs and lower lows. This type of structure typically reflects strong selling pressure and weak buyer confidence.

However, the most recent price action shows that this trend is losing strength. Instead of sharp downward movements, the market has shifted into sideways consolidation. This transition is often the first stage before a potential trend reversal.

Bearish Momentum Is Fading

One of the most important signals on the chart is the visible slowdown in bearish momentum.

Recent sell offs are smaller and less aggressive. At the same time, upward bounces are becoming stronger and more frequent. This shift indicates that sellers are gradually losing control of the market.

When a downtrend begins to weaken in this way, it often signals that the market is moving toward a period of accumulation.

Strong Support Zone Continues to Hold

The price region around 0.00003300 to 0.00003320 has become a key support zone.

Price has tested this area multiple times, and each time buyers have stepped in quickly to push the market higher. Repeated defense of a support level is a strong signal of growing demand.

Long downside wicks near the lows further confirm this behavior. These wicks show that buyers are actively rejecting lower prices and absorbing sell pressure.

This type of price action is commonly seen during accumulation phases when large buyers quietly build positions.

Early Signs of Higher Lows

After the sharp decline in early February, Terra Classic produced a strong rebound. Since then, the market has begun forming small higher lows.

This is an important structural change. A market that stops making lower lows is often preparing for a trend shift.

Higher lows suggest that buyers are gaining confidence and stepping in earlier during pullbacks.

Volatility Compression Signals a Potential Breakout

Price movement has become tighter and more compressed. This phase is known as volatility compression.

Compression typically occurs before a significant breakout because energy builds while buyers and sellers compete for control. The longer price remains stable above support, the stronger the eventual breakout can become.

This period of quiet consolidation is often where long term accumulation takes place.

Risk and Reward Perspective

Entering the market after a large rally usually carries higher risk. In contrast, periods of fear and consolidation often provide the best risk to reward opportunities.

At current levels, downside risk appears limited compared to the potential upside if a bullish reversal begins.

This positioning makes the current market structure attractive from a strategic perspective.

Bullish Scenario

If buyers continue defending the current support zone, the next major step would be a break above the short term lower high structure.

A confirmed breakout would likely attract momentum traders and increase market participation. This could mark the beginning of a broader recovery phase.

Conclusion

Terra Classic is showing multiple early signals of accumulation.

Bearish momentum is fading.

Support continues to hold.

Price is compressing ahead of a potential breakout.

While confirmation is still needed, the current structure suggests that the market may be building a base for a future bullish move.

Over 750,000 USTC Burned in the Last 12 Days as Supply Reduction Continues

0

Over 750,000 USTC Burned in the Last 12 Days as Supply Reduction Continues

The Terra Classic ecosystem continues to see consistent supply reduction activity as more USTC tokens are permanently removed from circulation. Over the past twelve days, a total of 759,618 USTC has been burned, highlighting ongoing community and ecosystem efforts to support long term supply reduction.

Token burns are widely followed by the community because they permanently reduce circulating supply. Over time, consistent burns are often viewed as a positive fundamental factor that can contribute to long term ecosystem recovery and confidence.

USTC Burn Recap

Below is the daily breakdown of USTC burned between February 1 and February 12.

Month Date USTC Burn
February 1 32,646
February 2 25,778
February 3 22,360
February 4 397,058
February 5 38,305
February 6 37,655
February 7 143,878
February 8 6,247
February 9 23,966
February 10 3,444
February 11 14,996
February 12 13,285
Total 759,618

Key Highlights

The most significant burn occurred on February 4, when more than 397,000 USTC were removed from circulation in a single day. Another notable burn happened on February 7, with nearly 144,000 USTC burned.

These two days alone accounted for the majority of the total burn, while the remaining days showed steady and consistent reductions.

Why USTC Burns Matter

USTC burns play an important role in the broader Terra Classic recovery narrative. Reducing supply is one of the key mechanisms used by the ecosystem to improve long term sustainability and strengthen community confidence.

Consistent burn activity signals ongoing participation from the ecosystem and demonstrates continued commitment to long term supply reduction strategies.

Final Thoughts

With over 750,000 USTC burned in less than two weeks, the Terra Classic ecosystem continues to move forward with steady supply reduction. While burns alone do not determine price movement, they remain an important fundamental metric closely watched by the community.

Ongoing consistency will be the key factor to monitor in the coming weeks as the burn trend continues.

Over 1.8 Billion LUNC Burned in Just 13 Days as Supply Reduction Accelerates

0

Over 1.8 Billion LUNC Burned in Just 13 Days as Supply Reduction Accelerates

The Terra Classic community continues to push forward with its long term supply reduction strategy. In the first thirteen days of February, more than 1.8 billion LUNC has already been permanently removed from circulation. This steady burn activity highlights the ongoing commitment to reducing supply and supporting the long term sustainability of the ecosystem.

Token burns remain one of the most important pillars of the Terra Classic recovery strategy. Every burn permanently removes tokens from circulation, gradually decreasing total supply over time. Consistent burn activity is often viewed by the community as a sign of continued network engagement and long term dedication to the project.

As of February 13, the total burn amount has reached 1,817,631,849 LUNC. It is important to note that the burn count for February 13 is still ongoing and is expected to increase before the day ends.

Daily LUNC Burn Breakdown

Month Date LUNC Burn
February 1 1,147,191,675
February 2 168,648,532
February 3 55,419,874
February 4 138,464,391
February 5 36,216,303
February 6 48,908,522
February 7 20,794,946
February 8 32,404,845
February 9 30,669,205
February 10 33,716,529
February 11 52,436,522
February 12 30,121,985
February 13 22,638,520*

*February 13 burn is still in progress.

Total Burned: 1,817,631,849 LUNC

What This Means for Terra Classic

The burn pace seen in early February demonstrates consistent activity across the ecosystem. While daily burn amounts vary, the overall trend shows steady progress toward reducing the circulating supply.

Supply reduction alone does not guarantee price movement, but it plays a critical role in the broader recovery framework. Combined with ongoing development, ecosystem growth, and community participation, continued burn activity remains a key metric closely watched by supporters and market participants.

With more days left in the month, the total burn figure is expected to continue rising, reinforcing the long term commitment to Terra Classic’s recovery path.

USTCC Proposal Explained in Simple Terms for Beginners

0

USTCC Overview

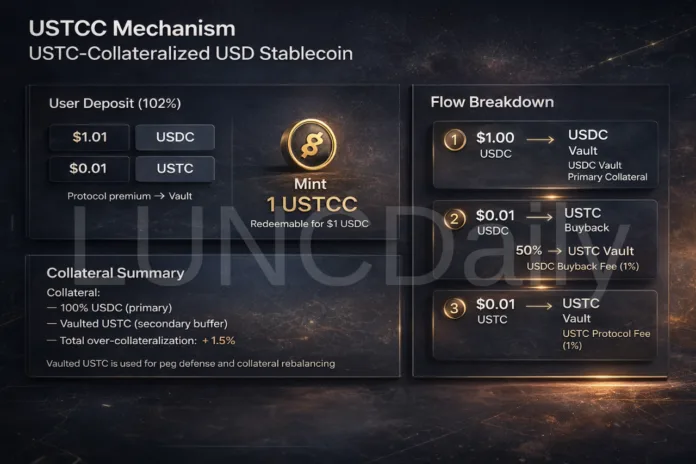
A 101.5% Over-Collateralized USD Stablecoin for Terra Classic

1. What USTCC Is

USTCC is a USD stablecoin built on Terra Classic designed to reduce USTC supply while providing a stable digital dollar for the ecosystem.

  • 1 USTCC is redeemable for 1 USDC
  • Over-collateralized from launch
  • Initial collateral ratio: 101.5%

2. Why USTCC Exists

USTC currently trades around $0.006 with more than 5.5 billion tokens in circulation.

USTCC introduces a system where every mint automatically:

  • Buys USTC
  • Burns USTC
  • Locks USTC in a vault

This reduces circulating supply and helps rebuild trust.

3. Core Objectives

  1. Deliver a 101.5% over-collateralized USD stablecoin
  2. Generate continuous buy, burn, and lock pressure on USTC
  3. Enable easy adoption with USDC-only minting (protocol handles USTC)
  4. Integrate with Terra Classic DeFi for real utility

4. Collateral Structure

Collateral Type Role
USDC Primary backing
USTC Secondary backing locked in governance vault

Total backing per USTCC = 101.5%

5. Minting Process (Per 1 USTCC)

To mint 1 USTCC, three actions are required.

Step 1 — Deposit Primary Collateral

Deposit 1.00 USDC stored in the USDC vault.

Step 2 — Pay USTC Premium

Deposit $0.01 worth of USTC sent directly to the USTC vault.

Step 3 — Pay Buyback Fee

Pay 0.01 USDC fee. The protocol swaps this to USTC on a DEX.

  • 50% burned permanently
  • 50% stored in the USTC vault

Result After Minting

  • $1.00 USDC
  • $0.015 USTC value

Total collateral = 101.5%

6. Redemption Rules

  • Burn 1 USTCC → receive 1 USDC
  • Minimum redemption: $10,000 USTCC
  • Daily redemption cap: 25% of circulating supply

7. USTC Vault Management

  • Stores all USTC premiums and buyback USTC
  • Auto-liquidation triggers if collateral falls below 101%
  • Governance controls future vault usage

8. Impact on USTC Supply

For every $1,000,000 USTCC minted:

Action Value
USTC Bought ~$10,000
USTC Burned ~$5,000
USTC Vaulted ~$5,000

Resulting Effects

  1. Buy pressure on DEX markets
  2. Permanent supply reduction via burns
  3. Reduced circulating supply via vault locking

9. Key Design Principles

  • No new USTC is minted
  • Fully collateralized model
  • Rising USTC price increases USTC acquired per fee
  • Deflation effect compounds over time

10. Benefits

  • Strong backing using USDC
  • Simple minting process
  • Continuous USTC deflation pressure
  • Compatible with Terra Classic DeFi

11. Risks and Mitigations

Risk Mitigation
USTC volatility Auto-liquidation and governance top-ups
Low adoption Incentives and DeFi integrations
Oracle and swap risks TWAP oracles and multi-DEX routing
Smart contract risk Full audits before launch

12. Summary

USTCC is a fully collateralized USD stablecoin that automatically buys, burns, and locks USTC every time new supply is minted. This creates continuous supply reduction while providing a stable USD asset for the Terra Classic ecosystem.