

Terra Classic Price Analysis Signals Early Accumulation Phase on the 4 Hour Chart
Terra Classic is showing early signs of a market transition after a prolonged downtrend. The latest four hour chart reveals a shift from aggressive selling toward price stabilization and accumulation. This stage is often the foundation for a potential recovery phase, especially when strong support repeatedly holds.
This article explains the current chart structure in simple terms so beginners can understand what the market is signaling.
Market Structure Is Shifting From Downtrend to Consolidation
The previous trend was clearly bearish, with consistent lower highs and lower lows. However, the most recent price action tells a different story. Instead of continuing to fall sharply, price has begun moving sideways within a tightening range.
This transition from trending movement to sideways compression is a critical development. Markets typically move through a cycle that includes trend, consolidation, and then reversal or continuation. The current phase suggests the downtrend is losing strength.
One of the earliest signs of this change is that price is no longer making strong new lows. Instead, movements are becoming smaller and more controlled.
Strong Support Zone Is Clearly Established
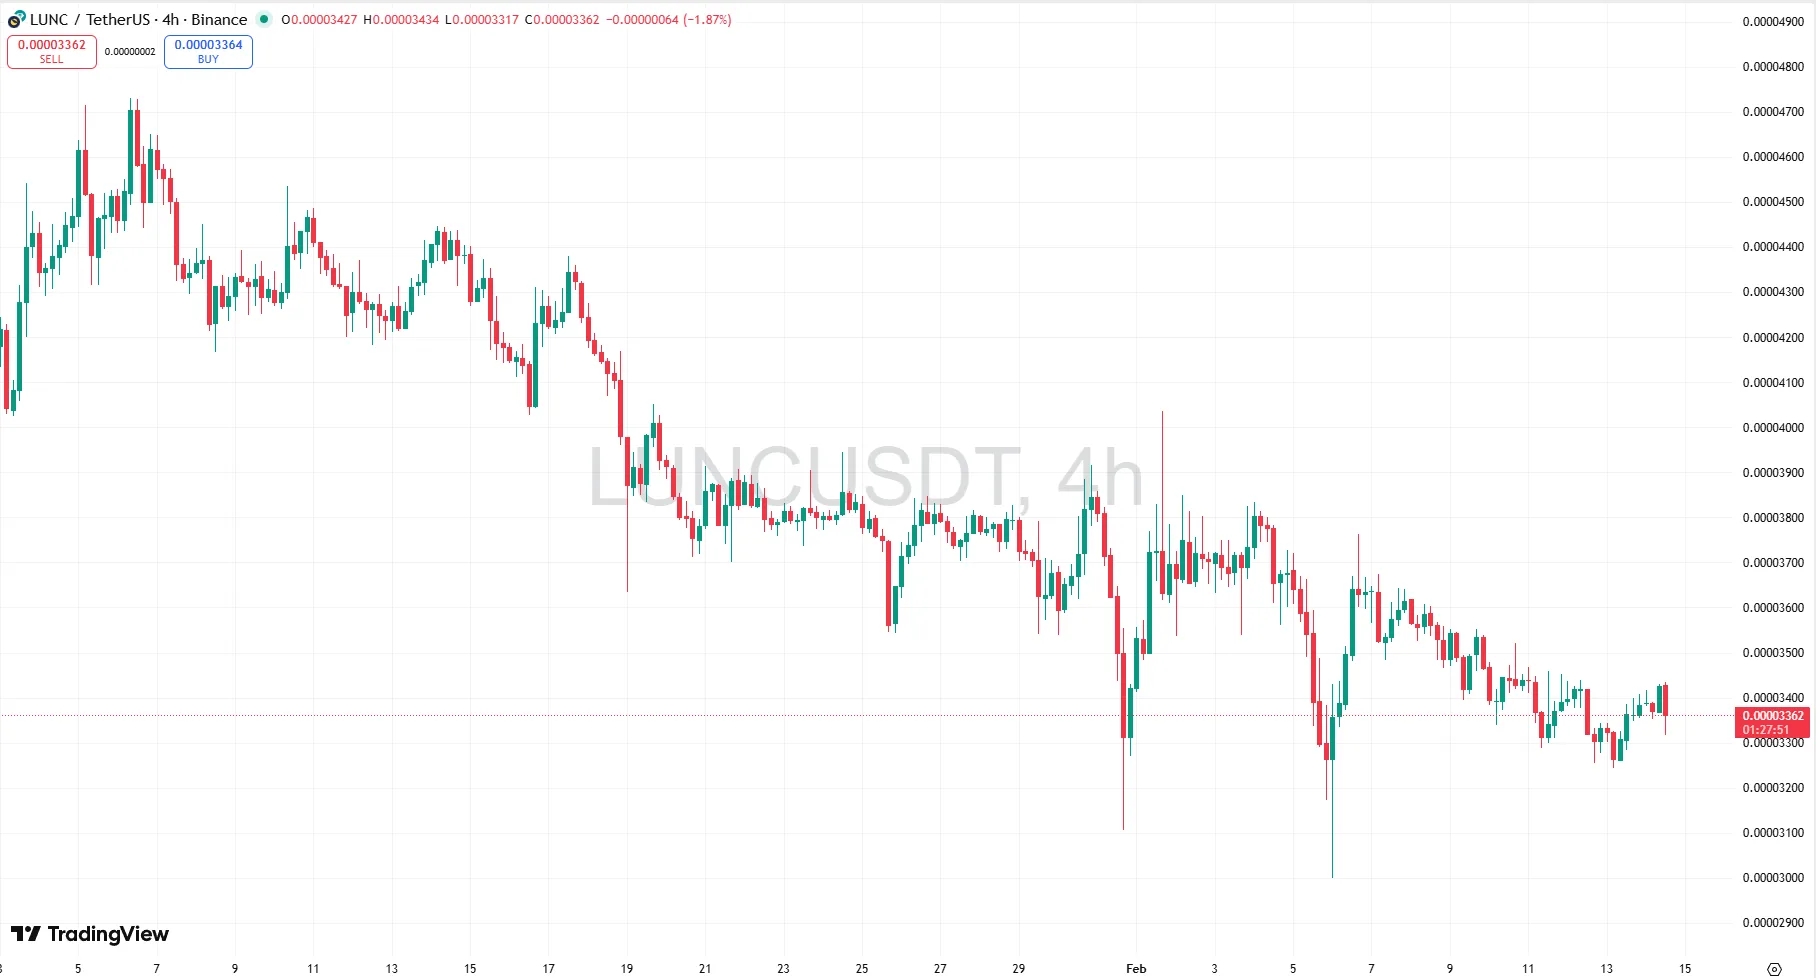
A major demand area has formed between 0.00003300 and 0.00003330. This zone has been tested multiple times, and each test shows strong buying activity.
Key signs of support strength include:
- Sharp downside wicks into the same price area
- Quick recoveries after selloffs
- Repeated returns above support
Long lower wicks are especially important. They indicate that sellers pushed the price down but buyers stepped in aggressively and pushed the price back up. When this happens repeatedly at the same level, it often signals accumulation by larger market participants.
Evidence of Seller Exhaustion Appears
One of the most important candles on the chart is a large bearish move that created a deep wick and immediately reversed. This type of price action is often called a liquidity sweep.
A liquidity sweep occurs when stop losses are triggered below support, followed by strong buying that quickly reverses the move. After this event, several changes became visible:
- Downward moves became weaker
- Bounces became faster
- Overall volatility began to compress
These changes suggest that selling pressure is fading and the market is stabilizing.
Early Signs of Higher Low Formation
Although the market still appears sideways, the internal structure is improving.
- Large selloffs are no longer creating meaningful new lows
- Small higher lows are beginning to form
- Price is holding above the key support zone
This represents the earliest stage of a potential trend reversal. Reversals rarely happen instantly. Instead, they begin with stabilization and gradual improvement in market structure.
Volatility Compression Signals Potential Breakout
Price is now trading inside a tightening range:
- Support near 0.00003300
- Resistance between 0.00003650 and 0.00003800
When volatility decreases after a downtrend, it often means the market is building energy for a larger move. This phase is commonly known as compression.
Compression does not guarantee direction, but when it appears after seller exhaustion and strong support, the probability of a bullish breakout increases.
Bullish Scenario to Watch
If the support zone continues to hold, the next important signal would be a breakout above resistance.
Key confirmation levels include:
- A strong candle closing above 0.00003650
- Continued movement above 0.00003800
A confirmed breakout could trigger a short term recovery as buyers re enter the market and momentum begins to shift.
Beginner Friendly Summary
The Terra Classic market is no longer strongly bearish. Selling pressure is weakening. Buyers are defending a clear support zone. Price is compressing within a tight range. This combination of signals suggests the market is entering an early accumulation phase, which often appears before a bullish reversal begins.